Moving Average Trading Strategy: Price Crossover – A Closer Look
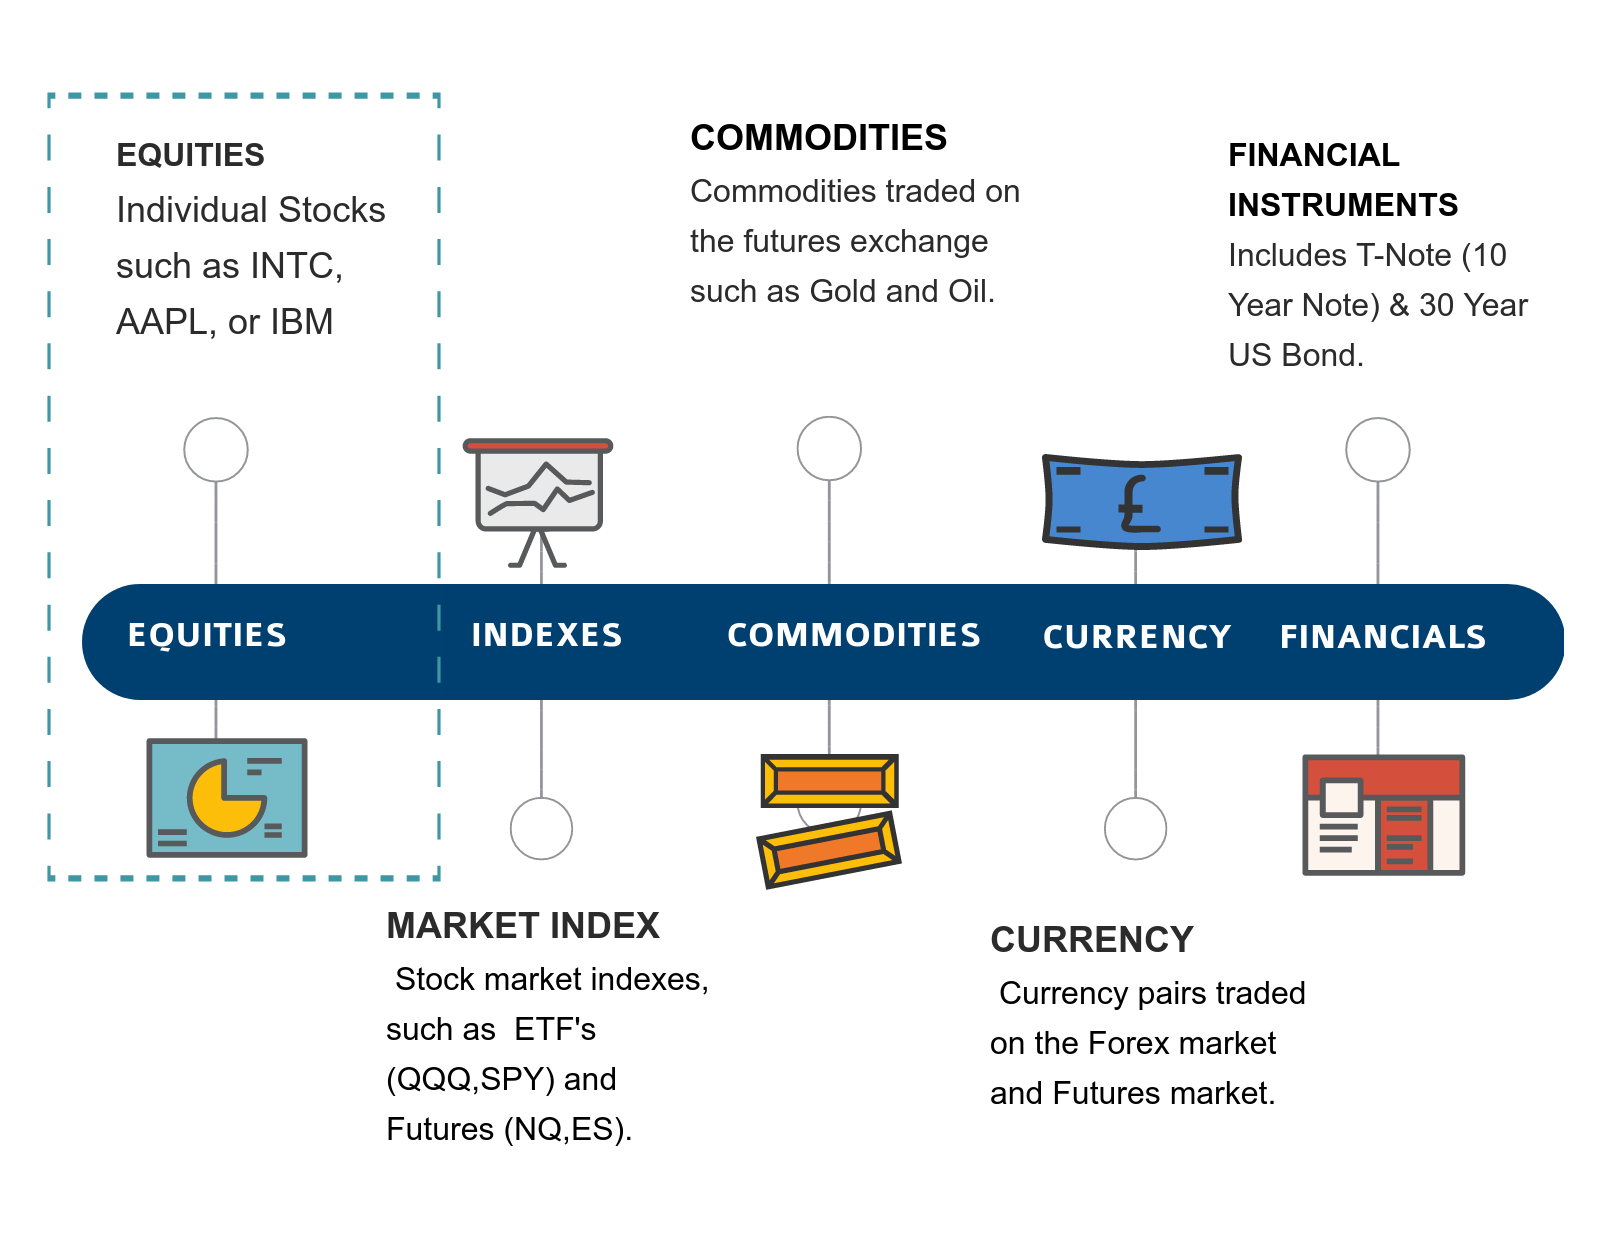
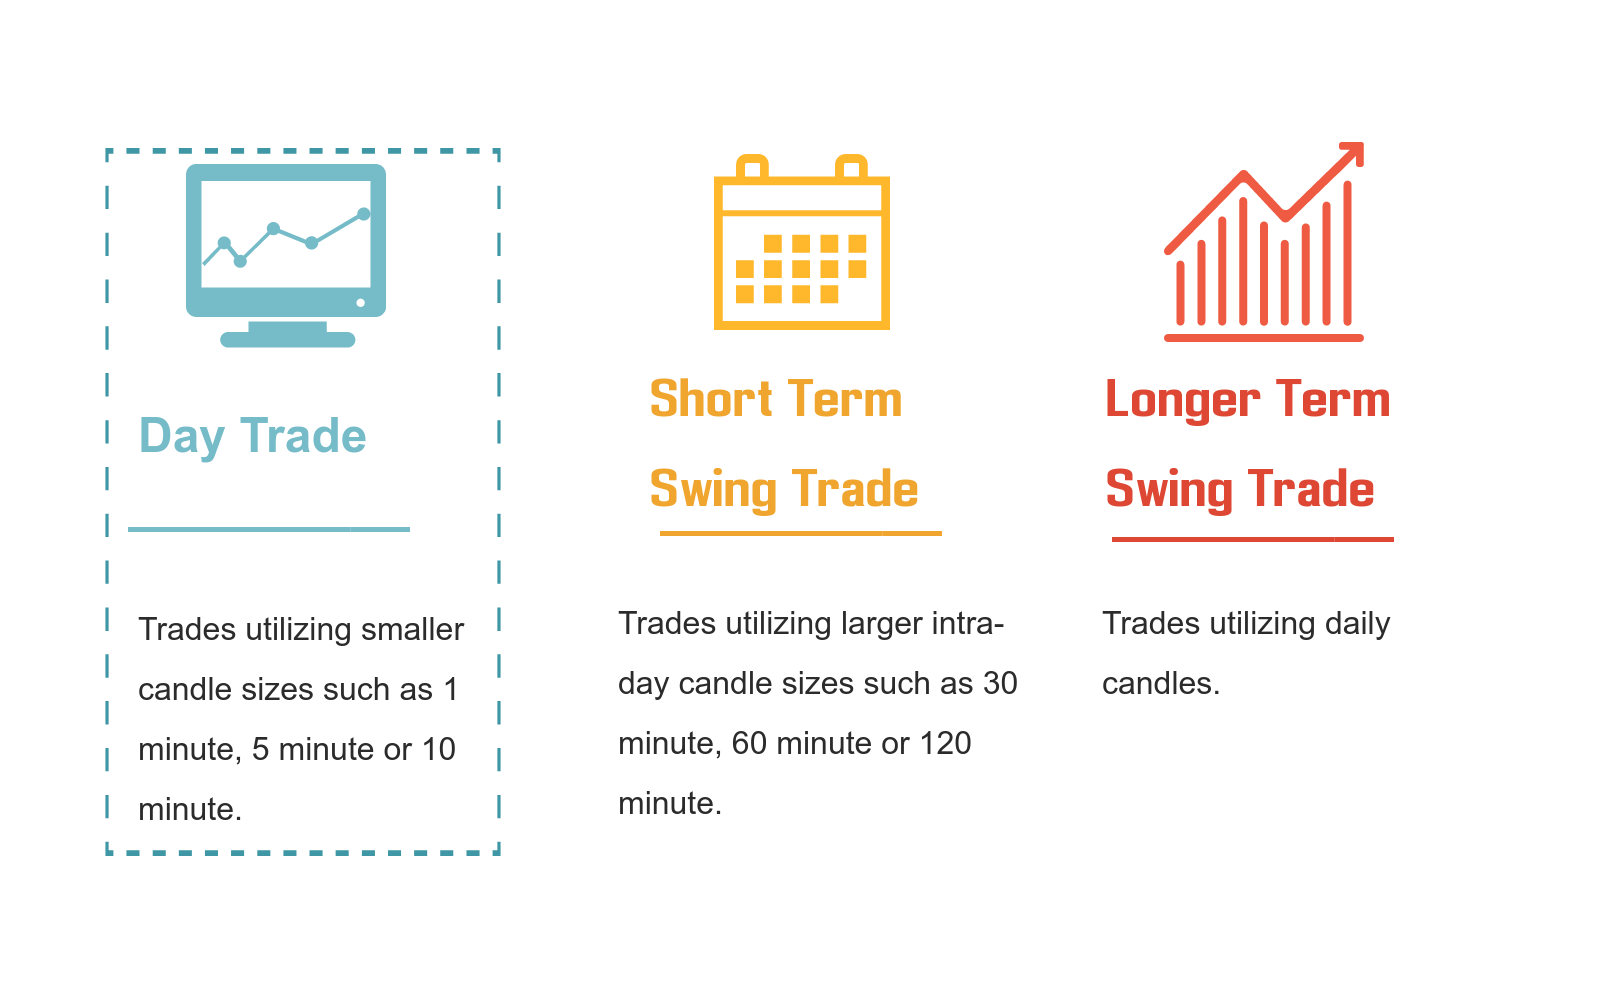
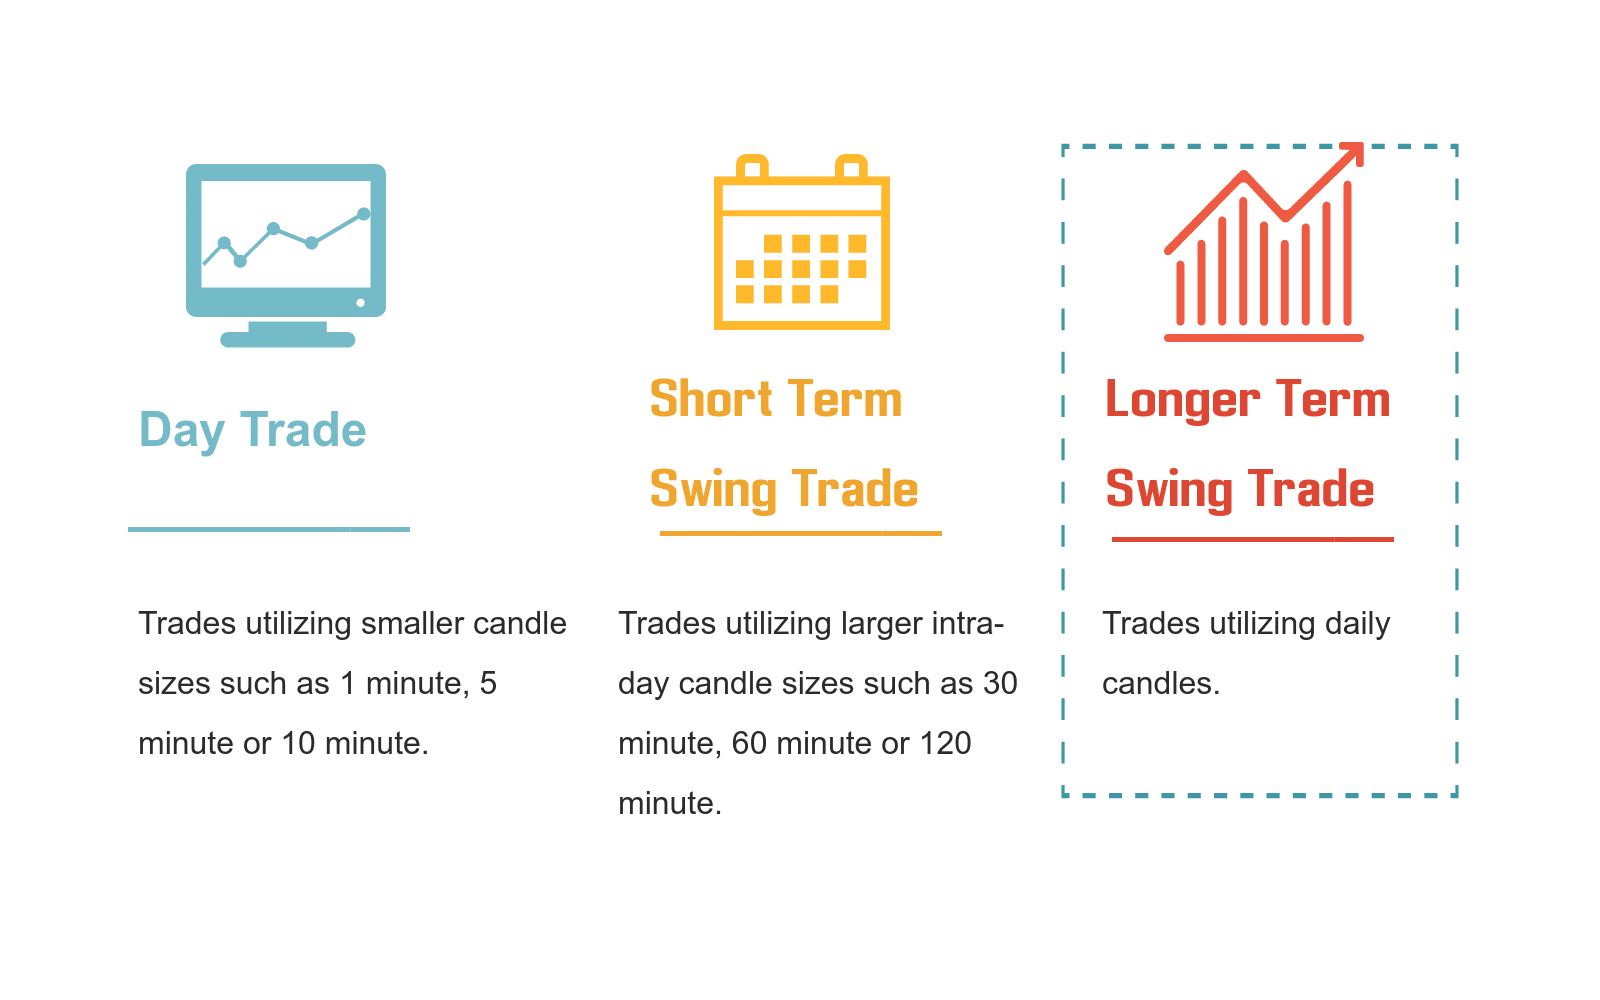
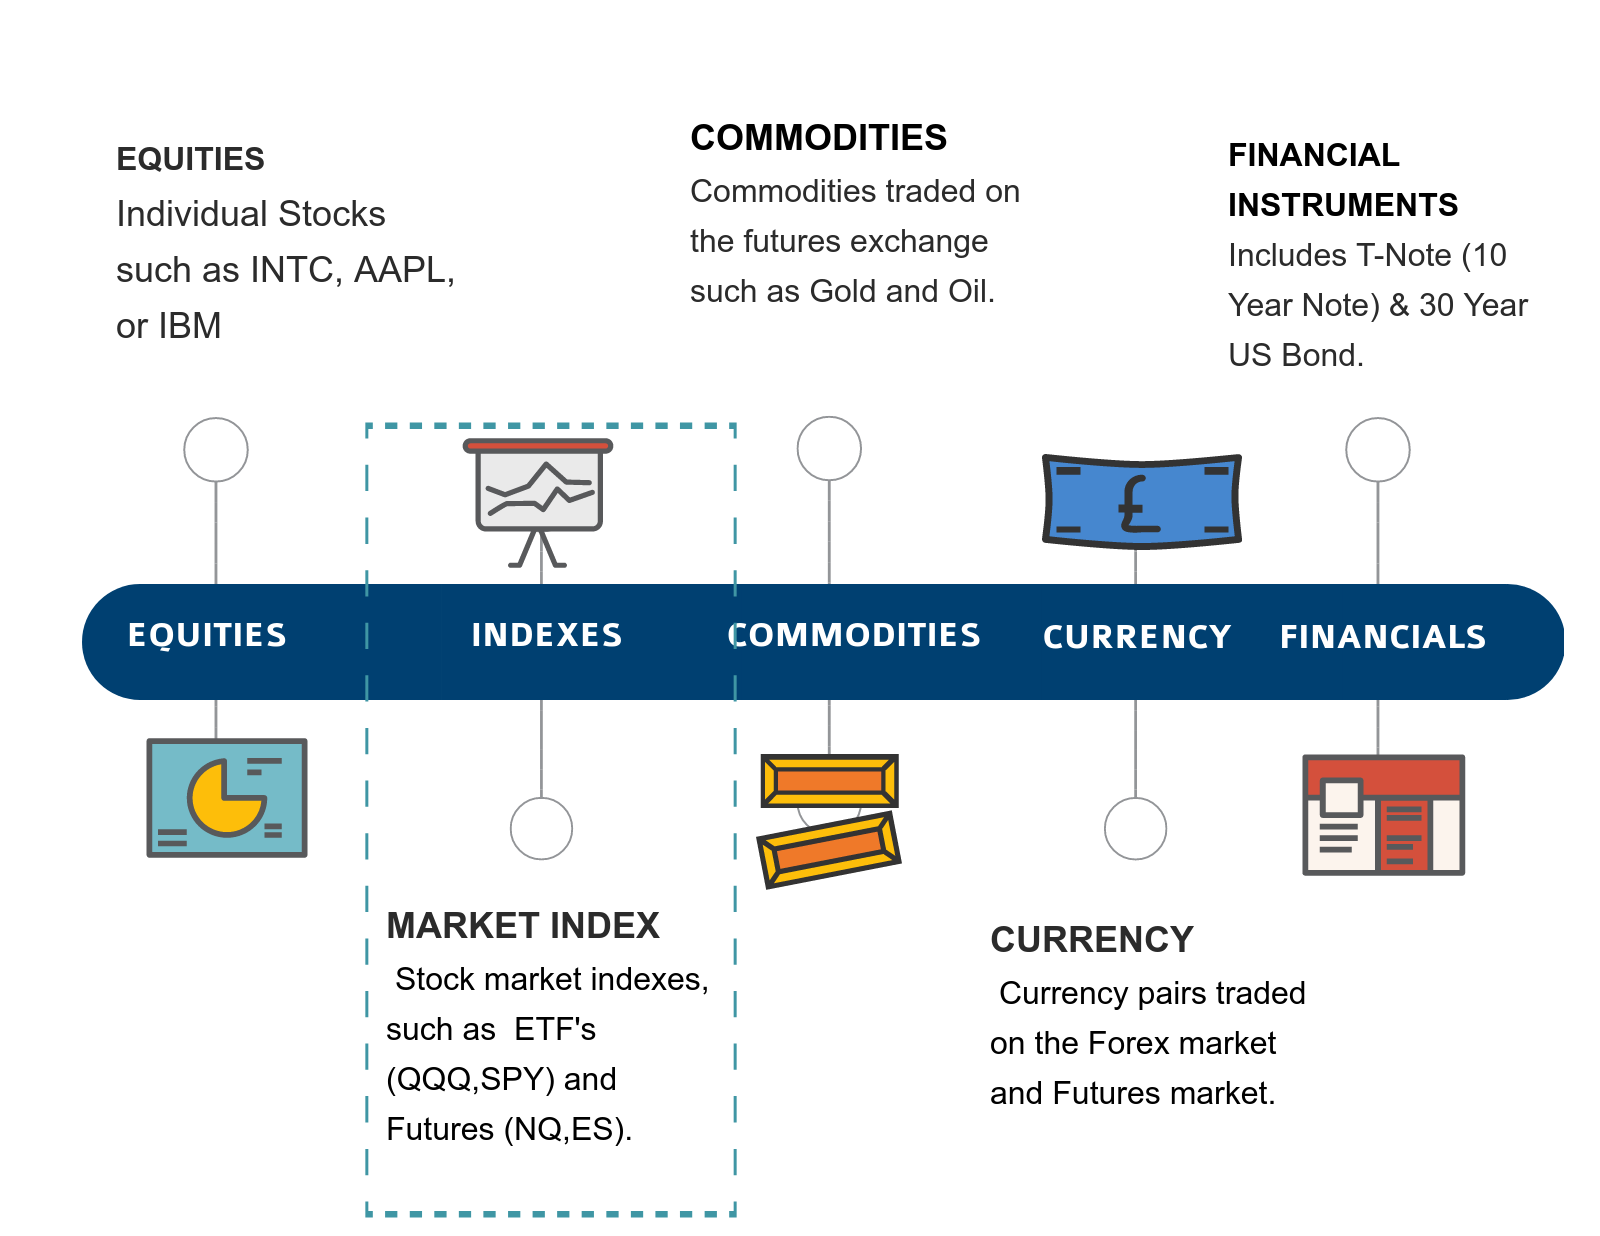
The Moving Average Price Crossover strategy can be applied to multiple trading styles. In order to simplify our analysis and provide what could be actionable ideas, we have broken down the performance of this technical trading systems into five different categories or assets to trade. Each asset can be analyzed based on the trading style: Day Trade, Swing Trade (shorter term) & Swing Trade (longer term).
The trading style is simply a function of the size of candles used in the simulation. For example, a day trading system would use smalelr candles such as 1 minute, 5 minute or 10 minute. Contrast that with a Longer Term Swing Trading system which would use daily candles.
Moving Average Price Crossover System: Equities
Trade Entry/Exit Rules
Stop Settings:
No Stop Used
Limit Settings:
No Limit (target) Used
Buy Trigger(s):
Moving Average #1 Close Above, New Close Only
Sell Trigger(s):
Moving Average #1 Close Below, New Close Only
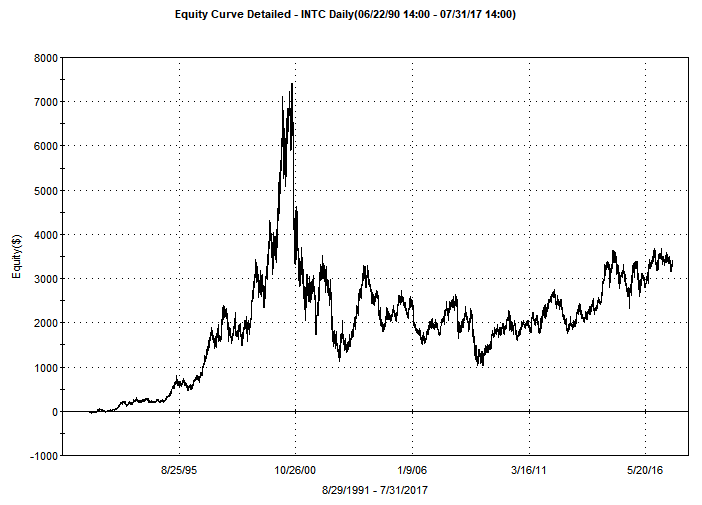
INTC (Intel Corporation) Buy & Hold
The following data represents the Buy & Hold results during the period analyzed. This data assumes 100 shares were purchased at the beginning of the back-tested period and sold towards the end. It can be used to compare the Trading Strategies performance with the baseline, Buy & Hold results.
| Simulation Setting | |
| Asset Type | Equities |
| Symbol | INTC |
| Start Date | 08/29/1991 |
| End Date | 07/31/2017 |
| Trading Session Time | Regular Session Hours |
| Trading Application | Swing Trade (longer term) |
| Candle Size | 1 Day |
| Direction | Long |
| Moving Average Type | SMA |
| Moving Average Length | 300 |
| Performance Metric | |
| Profit Factor | 0.00 |
| Net Profit ($) | $3314.00 |
| Gross Profit ($) | $3314.00 |
| Gross Loss ($) | $ 0.00 |
| Total Trades | 1 |
| Average Gain/Trade | $3314.00 Per Trade |
| Percent Profitable | 100.00% |
| Maximum Drawdown | $-6280.00 |
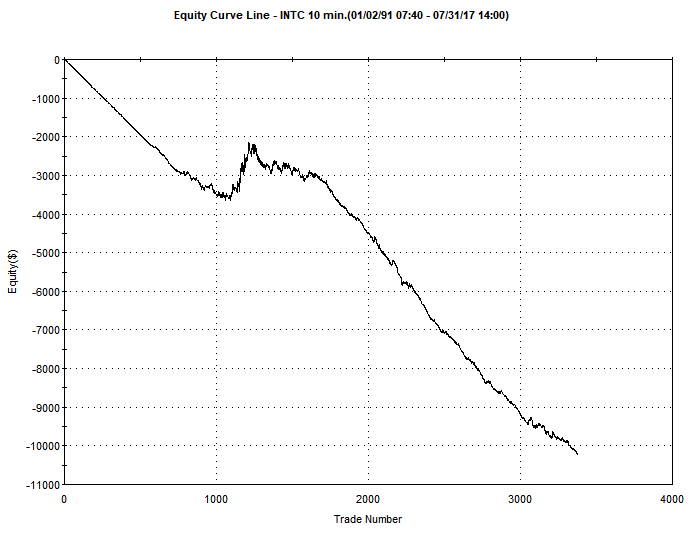
LONG Entry Results: Day-Trade
| Simulation Setting | |
| Asset Type | Equities |
| Symbol | INTC |
| Start Date | 03/06/1991 |
| End Date | 07/31/2017 |
| Trading Session Time | 930EST to 1600EST |
| Trading Application | Day Trade |
| Candle Size | 10 Minutes |
| Direction | Long |
| Moving Average Type | SMA |
| Moving Average Length | 300 |
| Performance Metric | |
| Profit Factor | 0.64 |
| Net Profit ($) | $-10209.00 |
| Gross Profit ($) | $17899.00 |
| Gross Loss ($) | $-28108.00 |
| Total Trades | 3376 |
| Average Gain/Trade | $-3.02 Per Trade |
| Percent Profitable | 20.17% |
| Maximum Drawdown | $-10220.00 |
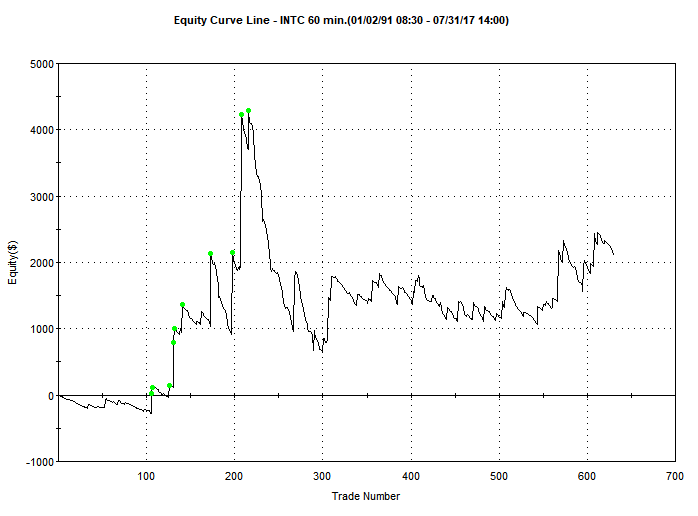
LONG Entry Results: Swing-Trade (shorter term)
| Simulation Setting | |
| Asset Type | Equities |
| Symbol | INTC |
| Start Date | 03/06/1991 |
| End Date | 07/31/2017 |
| Trading Session Time | 930EST to 1600EST |
| Trading Application | Swing Trade (shorter term) |
| Candle Size | 60 Minutes |
| Direction | Long |
| Moving Average Type | SMA |
| Moving Average Length | 235 |
| Performance Metric | |
| Profit Factor | 1.14 |
| Net Profit ($) | $2108.00 |
| Gross Profit ($) | $17112.00 |
| Gross Loss ($) | $-15004.00 |
| Total Trades | 631 |
| Average Gain/Trade | $3.34 Per Trade |
| Percent Profitable | 16.48% |
| Maximum Drawdown | $-4551.00 |

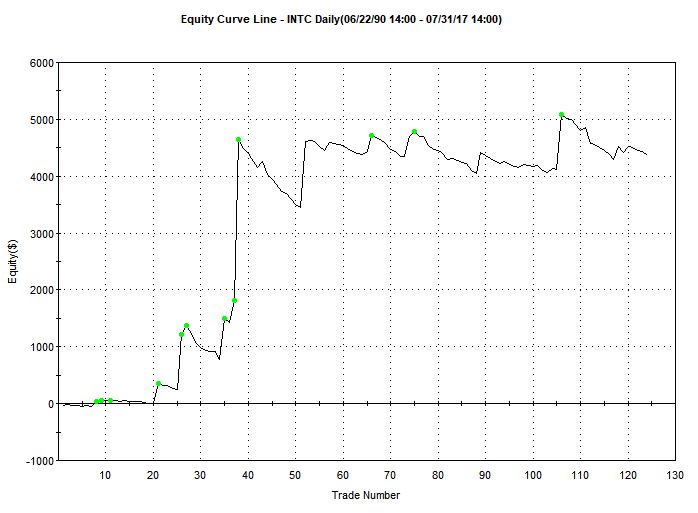
LONG Entry Results: Swing Trade (longer term)
| Simulation Setting | |
| Asset Type | Equities |
| Symbol | INTC |
| Start Date | 08/29/1991 |
| End Date | 07/31/2017 |
| Trading Session Time | Regular Session Hours |
| Trading Application | Swing Trade (longer term) |
| Candle Size | 1 Day |
| Direction | Long |
| Moving Average Type | SMA |
| Moving Average Length | 165 |
| Performance Metric | |
| Profit Factor | 1.82 |
| Net Profit ($) | $4369.00 |
| Gross Profit ($) | $9677.00 |
| Gross Loss ($) | $-5308.00 |
| Total Trades | 124 |
| Average Gain/Trade | $35.23 Per Trade |
| Percent Profitable | 25.81% |
| Maximum Drawdown | $-2426.00 |
CFTC RULE 4.41: Results are based on simulated or hypothetical performance results that have certain inherent limitations. Unlike the results shown in an actual performance record, these results do not represent actual trading. Also, because these trades have not actually been executed, these results may have under-or over-compensated for the impact, if any, of certain market factors, such as lack of liquidity. Simulated or hypothetical trading programs in general are also subject to the fact that they are designed with the benefit of hindsight. No representation is being made that any account will or is likely to achieve profits or losses similar to these being shown.
Moving Average Price Crossover Trading Strategy: Market Indexes
Trade Entry/Exit Rules
Stop Settings:
No Stop Used
Limit Settings:
No Limit (target) Used
Buy Trigger(s):
Moving Average #1 Close Above, New Close Only
Sell Trigger(s):
Moving Average #1 Close Below, New Close Only
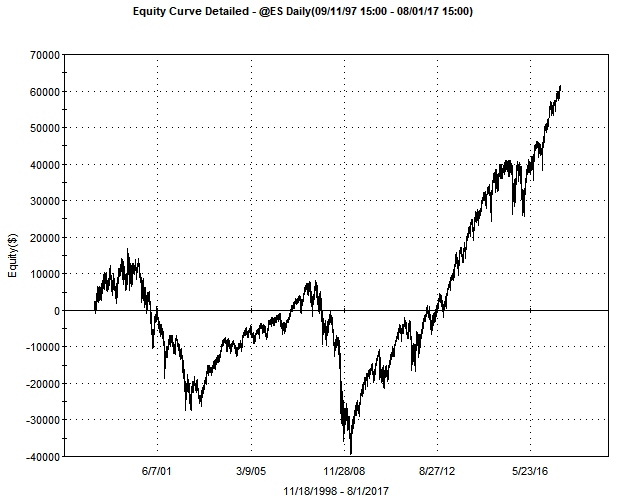
S&P 500 Buy & Hold
The following data represents the Buy & Hold results during the period analyzed. This data assumes 1 contract was purchased at the beginning of the back-tested period and sold towards the end. It can be used to compare the Trading Strategies performance with the baseline, Buy & Hold results.
| Simulation Setting | |
| Asset Type | Futures |
| Symbol | @ES |
| Start Date | 11/18/1998 |
| End Date | 08/01/2017 |
| Trading Application | Buy and Hold |
| Direction | Long |
| Net Profit ($) | $61,132.50 |
| Maximum Drawdown | -$54,962.50 |
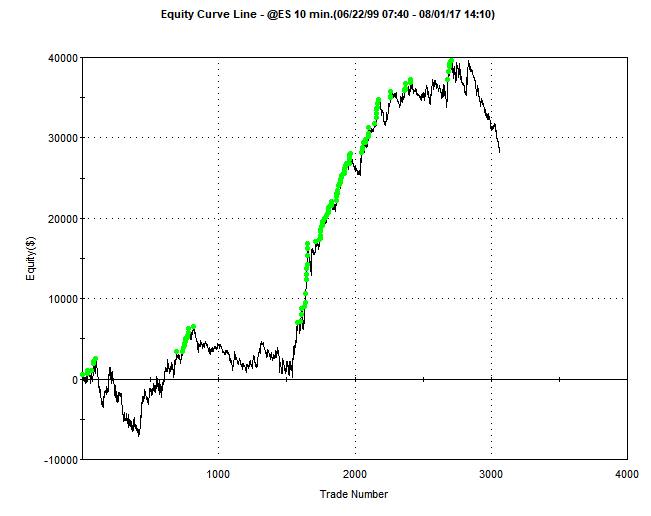
LONG Entry Results: Day-Trade
| Simulation Setting | |
| Asset Type | Futures |
| Symbol | @ES |
| Start Date | 08/23/1999 |
| End Date | 08/01/2017 |
| Trading Session Time | 930EST to 1610EST |
| Trading Application | Day Trade |
| Candle Size | 10.00 Minutes |
| Direction | Long |
| Moving Average Type | EMA |
| Moving Average Length | 190 |
| Performance Metric | |
| Profit Factor | 1.11 |
| Net Profit ($) | $28365.00 |
| Gross Profit ($) | $291165.00 |
| Gross Loss ($) | $-262800.00 |
| Total Trades | 3062 |
| Average Gain/Trade | $9.26 Per Trade |
| Percent Profitable | 29.29% |
| Maximum Drawdown | $-11428.75 |
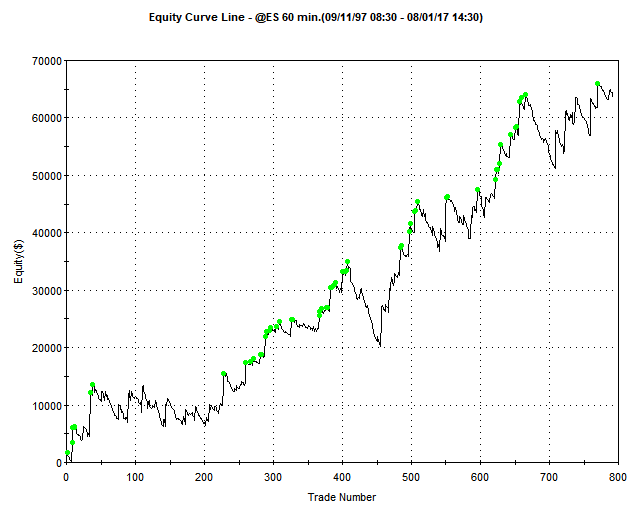
LONG Entry Results: Swing-Trade (shorter term)
| Simulation Setting | |
| Asset Type | Futures |
| Symbol | @ES |
| Start Date | 11/11/1997 |
| End Date | 08/01/2017 |
| Trading Session Time | 930EST to 1610EST |
| Trading Application | Swing Trade (shorter term) |
| Candle Size | 60.00 Minutes |
| Direction | Long |
| Moving Average Type | EMA |
| Moving Average Length | 110 |
| Performance Metric | |
| Profit Factor | 1.34 |
| Net Profit ($) | $63635.00 |
| Gross Profit ($) | $251000.00 |
| Gross Loss ($) | $-187365.00 |
| Total Trades | 793 |
| Average Gain/Trade | $80.25 Per Trade |
| Percent Profitable | 27.11% |
| Maximum Drawdown | $-15202.50 |
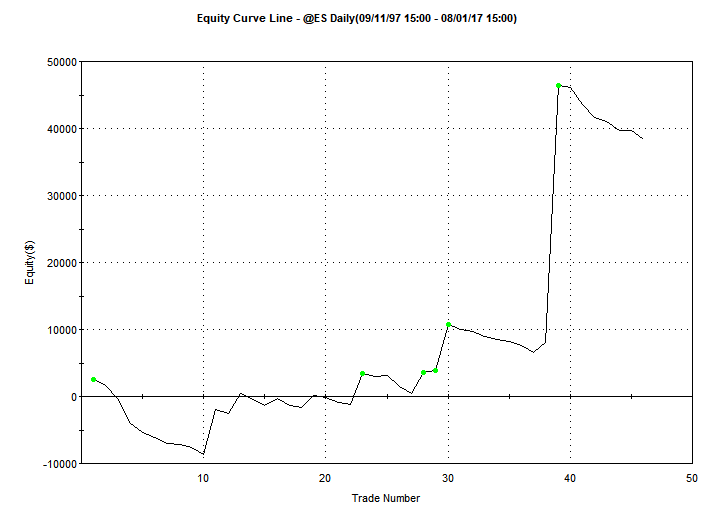
LONG Entry Results: Swing Trade (longer term)
| Simulation Setting | |
| Asset Type | Futures |
| Symbol | @ES |
| Start Date | 11/18/1998 |
| End Date | 08/01/2017 |
| Trading Session Time | Regular Session Hours |
| Trading Application | Swing Trade (longer term) |
| Candle Size | 1 Day |
| Direction | Long |
| Moving Average Type | SMA |
| Moving Average Length | 300 |
| Performance Metric | |
| Profit Factor | 2.21 |
| Net Profit ($) | $38420.00 |
| Gross Profit ($) | $70165.00 |
| Gross Loss ($) | $-31745.00 |
| Total Trades | 46 |
| Average Gain/Trade | $835.22 Per Trade |
| Percent Profitable | 26.09% |
| Maximum Drawdown | $-17691.25 |
CFTC RULE 4.41: Results are based on simulated or hypothetical performance results that have certain inherent limitations. Unlike the results shown in an actual performance record, these results do not represent actual trading. Also, because these trades have not actually been executed, these results may have under-or over-compensated for the impact, if any, of certain market factors, such as lack of liquidity. Simulated or hypothetical trading programs in general are also subject to the fact that they are designed with the benefit of hindsight. No representation is being made that any account will or is likely to achieve profits or losses similar to these being shown.
Step 6. Grade The Trading System
How Good Is This Strategy?
First pass criteria include looking at Profit Factor , Maximum Drawdown and Total Number of Trades. For AlgorithmicTrading.net, if a trading systems passes an initial step of testing, we will analyze it further to include performing multiple cross optimizations, performing in-sample & out-of-sample testing using the Tradestation Walk-Forward Analysis test.
Price Crossing Moving Average Trading Strategy: LONG Entry
Very Small Number of Trades
This strategy has less than 200 trades in the back-testing. The larger number of trades in the back-testing, the more reliable the study. Many swing trading algorithms which hold for a longer duration will have a much smaller number of trades. As long as it is back-tested through Bull & Bear markets, it is simply a warning.
Very High Profit Factor
This strategy has a profit factor above 1.30.
Large Draw down
This strategy has a very high drawdown (compared to potential gains). This is a very big red flag. Per unit trade size allocation should be approximately 2-3X the max drawdown size. This implies the system could have a lot of volatility and potential gains (on a percent basis) will be lower.
Low Risk of Curve Fitting
This strategy only utilizes two inputs, the SMA/EMA and Moving Average Lengths between 5 and 300 days (5 day increments). Optimization increments are fairly large (5 day’s). Schmoo of moving average length shows a stead progression of performance as the moving average length increases. This is a solid positive in that there is consistency.
Large Average Gain Per Trade
This strategy has a very large average gain per trade. This helps ensure that an increase in slippage (from bad fills) does not have a large impact on the systems performance. Trading strategies that hold for longer periods will typically do better than systems which enter and exit the same day.
Risk of Large Loss
This strategy does not use a stop. Systems that don’t use stops tend to have better performance numbers, however there is a larger risk than normal, given that a large move against this position could create an unpredictably large loss.
Price Crossing Moving Average: Final Grade
The entry & exit rules for this strategy are explained in a consistent way – in probably every single book on technical analysis. The biggest problem with their rules is that they are almost always too vague. They leave it up to the reader to pick the chart size (5 min, 10 min, 60 min or daily) and tend to reference the 20 day, 50 day and 200 day moving averages as being good ones to use.
The Good
The Moving Average Price Crossover strategy is consistently defined across multiple sources. Most reference daily charts – which appear to be more reliable than using this strategy as a day trade. At least using daily charts, there is consistency with regard to the most optimal Moving Average Length. As the length increases, so do potential profits until a plateau is reached.
The Bad
The Moving Average Price Crossover strategies you will find online are good at being vague. They leave it up to the trader to determine the best Moving Average Length. Some are braver than others – referencing the 200 Day, 50 Day and 20 Day moving averages.
The Ugly
Drawdowns are too large as compared to potential gains.
Final AlgoGrader Score
Our opinion is that this strategy – as defined in this study – is not worthy of additional testing (walk-forward then live trades). While the back-testing does show gains and a fairly high profit factor, there are simply too many negatives to ignore. The primary issue being the drawdown.
%
AlgoGrader Score: D
Summary Of Our Findings & Best Practices
- The larger the Moving Average Length the better, up until a certain point – where increases to profitability reach a plateau.
- The EMA does appear to provide a small benefit with this trading system (compared to using an SMA). Preference should be given to Exponentially Weighted Moving Averages.
- As defined in this study, the strategy (both long and short) has some potential, however the small number of trades and large drawdowns are issues.