The Swing Trader Has A Great Track Record With Over 332 Live Trades Logged

Past performance is not indicative of future performance. Trading futures & options is not for everyone and involves substantial risk of loss.
| Performance Analysis (per $15,000 traded) | |
| Total $ Gain | +$24,209 |
| Avg $ Gain/Mo | +$621 |
| Avg % Gain/Mo | +4.14% |
| Total # Trades | 332 |
| Period Traded | 10/1/2015 – 1/9/2019 |
| Per Trade Win Rate | 74.40% |
| Slippage/Commission Used in Analysis (For Hyp. Trades Only) | |
| Commission used in all reports (Futures Trade) | $6.50 per round trip trade (all-in) |
| Slippage used in all reports (ES) | $12.50 per round trip trade |
| Slippage used in all reports (TY) | $24.00 per round trip trade |
| Draw-Down (per $15,000 traded) | |
| Worst $ draw-down (closing trade to closing trade) | -$8,855* |
| Period Seen | 1/25/18-5/29/18 |
| Account Details | |
| Per Unit Trade Size | $15,000 |
| Instrument traded | ES/TY |
| Trades Futures | Yes |
| Account types allowed | Cash, IRA, Roth IRA |
| Licenses available | Yes |
| Licensing fee | Contact Us for Pricing |
*Estimated closing trade to closing trade draw-down based on walk-forward/out-of-sample period (see disclaimer, below). Note that heavier losses than indicated are possible. Maximum Draw down can be used to determine the measure of risk involved with any given trading system. It represents the maximum peak to valley loss seen on the account during the walk-forward trading period.
CFTC RULE 4.41: Results are based on simulated or hypothetical performance results that have certain inherent limitations. Unlike the results shown in an actual performance record, these results do not represent actual trading. Also, because these trades have not actually been executed, these results may have under-or over-compensated for the impact, if any, of certain market factors, such as lack of liquidity. Simulated or hypothetical trading programs in general are also subject to the fact that they are designed with the benefit of hindsight. No representation is being made that any account will or is likely to achieve profits or losses similar to these being shown.
The Swing Trader Walk-Forward Equity Curve
The following equity curve shows the post-optimization, out of sample hypothetical account balance for this automated futures trading system. Back-testing does have significant limitations – therefore comparing an out-of-sample/walk-forward equity curve with the in-sample/back-tested equity curve can provide helpful information with regard to the efficiency of an algorithm.
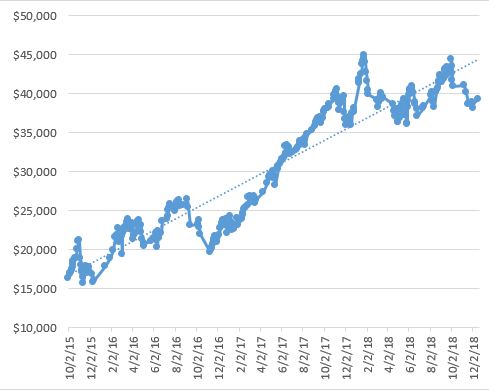
This equity curve represents the walk-forward results since this package was last optimized in October 2015. It is non-compounded, 1 contract was utilized on each trade. This algorithmic trading system trades 1 contract per $15,000. Past performance is not indicative of future performance. Trading futures involves substantial risk of loss and is not appropriate for all investors.
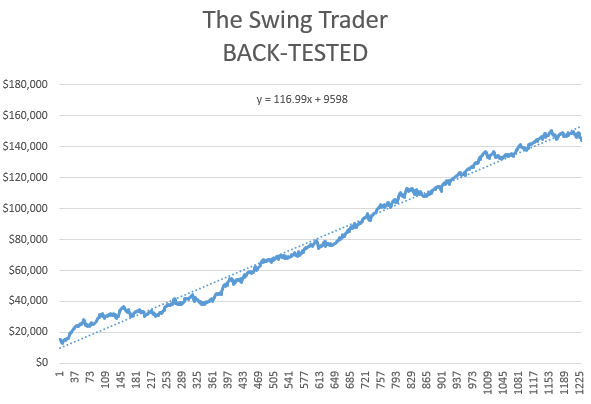
The Swing Trader Back-Tested Equity Curve
The following equity curve shows the back-tested equity curve for the swing trader. The slope of the trend-line added can be compared to the slope of the out-of-sample/walk-forward equity curve (above) to get a gauge for the efficiency of this trading system. Among other stats, you can also compare average gain per trade, maximum draw-down and percent profitable to determine the efficiency of a trading system. When doing this, we will compare the back-tested numbers with the live (walk-forward) numbers – expecting them to line up fairly consistently.
CFTC RULE 4.41: Results are based on simulated or hypothetical performance results that have certain inherent limitations. Unlike the results shown in an actual performance record, these results do not represent actual trading. Also, because these trades have not actually been executed, these results may have under-or over-compensated for the impact, if any, of certain market factors, such as lack of liquidity. Simulated or hypothetical trading programs in general are also subject to the fact that they are designed with the benefit of hindsight. No representation is being made that any account will or is likely to achieve profits or losses similar to these being shown.
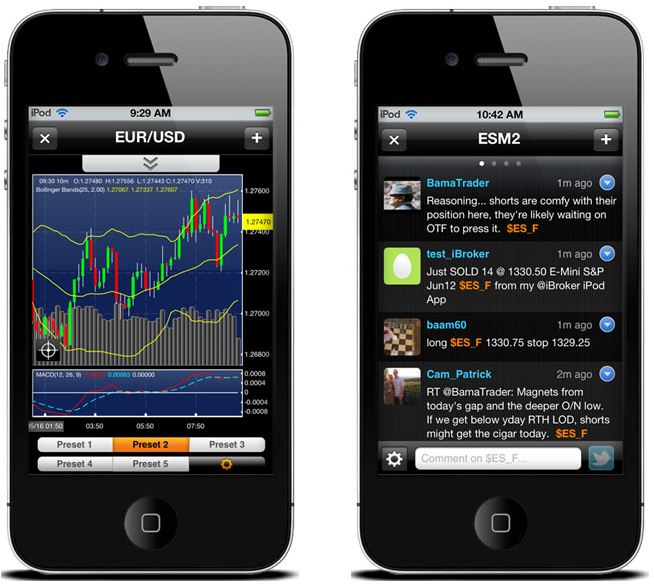
Follow Along In Real-Time Using OEC iBroker
Using this app you are able to receive push notifications when we get into a new trade, see limit and stop market orders, charts of the S&P Emini and Ten Year Note, plus current account balance and much more. Select brokers utilize the OEC iBroker App (iPhone and Android), ask us for more details.

The Swing Trader Trade List: Non-Compounded, Trading $60,000 (4 Units)
Data assumes $60,000 starting account, trading 4 Units (4 contract per trade). Includes commission. Results are considered walk-forward, meaning they are out-of-sample. Trades which show slippage are hypothetical, while zero slippage trades are taken from actual brokerage accounts. This data is non-compounded (ie throughout the entire period, only 4 contracts were traded).
[infogram id=”d94ee959-a4a1-448c-8ccb-f3629ca49912″ prefix=”qHc”]
CFTC RULE 4.41: Results are based on simulated or hypothetical performance results that have certain inherent limitations. Unlike the results shown in an actual performance record, these results do not represent actual trading. Also, because these trades have not actually been executed, these results may have under-or over-compensated for the impact, if any, of certain market factors, such as lack of liquidity. Simulated or hypothetical trading programs in general are also subject to the fact that they are designed with the benefit of hindsight. No representation is being made that any account will or is likely to achieve profits or losses similar to these being shown.
The Swing Trader Features
Trades Our Two Most Successful Algos
Trades our two most successful algorithms since going live. The Momentum & Treasury Note strategies have traded live since December 2014 and October 2015 respectively. In this combined system, performance is tracked when both strategies went live.
100% Automated Futures Trading System
The Swing Trader is a fully automated futures trading system, with zero time commitment required. Receive real-time trade alerts on your phone, and daily statements.
Designed To Outperform In Both Bull & Bear Markets
It is impossible to predict market direction with 100% certainty. Our methodology is to acknowledge this fact and trade the Ten Year Note and the S&P Emini’s to take advantage of both market conditions.
Liquid Market Traded
Places swing trades on the S&P Emini Futures (ES) and Ten Year Note (TY) – two of the most liquid futures instruments available.
Start Auto-Trading Today With The Swing Trader