Use Our Iron Condor Weekly Options Trading Strategy With as Little as $10,000 Starting Account.

In this video our lead developer reviews the Iron Condor Weekly Options Trading Strategy in great detail. Trading futures & options involves substantial risk of loss and is not appropriate for all investors.
The Basics of Weekly Options Trading
Weekly options refer to options that expire on a weekly basis. The advantage of trading weekly options as it pertains to our options trading algorithms is that we will not hold any positions over the weekend. Weekly Options have been around for over a decade now, however they began seeing more widespread use just after the great recession. The S&P 500 Emini Futures have Options contracts on them that trade similar to the SPY ETF Weekly Options. With our Algorithmic Weekly Options Trading Strategies, we typically sell the options on Monday and hold until Friday’s expiration.

Picture of bid x ask spread for an ES Weekly Option.
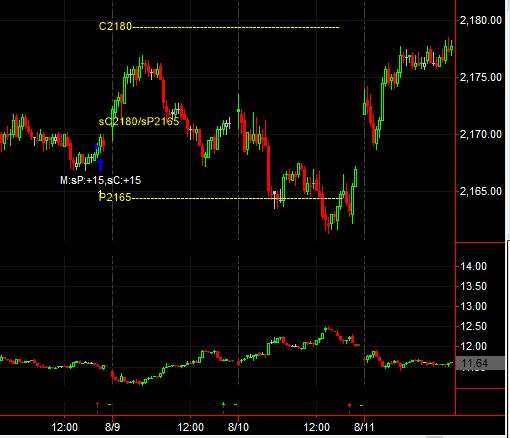
Picture of an Iron Condor Weekly Options Trade – with strike prices highlighted in yellow.
An Example of Weekly Options Trading With An Iron Condor
Our weekly options trading strategy uses an Iron Condor to place trades when our market prediction algorithms expect the market to trade within a range. Of course, these predictions are not 100% accurate – however by utilizing Iron Condors, there is some margin for error. This weekly options trading algo sells 1 Call and 1 Put Option (both out of money). In addition, it buys a deeper out of money call and put to protect us from a black swan kind of event where the market moves a tremendous amount against our Iron Condor trade. Our best case scenario, is that the Futures close on Friday between our Short Call and Short Put. In that case, both options expire worthless and we keep all of the premium.
Iron Condor Weekly Options Trading Strategy Highlights:
Initiates Iron Condor Trades
Instead of buying the ES futures when a ‘Buy trade’ is generated, the Iron Condor Package sells a weekly PUT & CALL option trading between 10-20 points out-of-money. In addition, it will buy a deeper out of money PUT & CALL to limit the downside loss potential.
100% Automated Options Trading System
The Iron Condor Package is fully automated through our auto-execution brokers. Receive real-time trade alerts on your phone and daily statements
Back-tested per trade win rate of 80.79%
We back-test each of our algorithms over 15 years.While back-testing an options algorithm poses different challenges, our back-testing shows that when we initiate an Iron Condor Weekly Options trade, we are profitable on that trade over 80% of the time. Refer to disclaimer CFTC RULE 4.14 (below) for limitations on back-testing.
Works Well In Sideways Markets
Iron Condor trades typically do well in sideways moving markets. This happens to be the primary weakness of our other “futures” algorithms. The data suggests that adding the Iron Condor package to the ESTY Futures package creates a robust trading system, such as the S&P Crusher. The Iron Condor trading strategy can also be traded alone as a stand along package.
- Combined Performance – All Algorithms
- Back-Testing Information
- Algorithms Traded
- Account Requirements & Pricing
| Yearly Analysis (per $10,000 traded) | |
| Average % gain per year | 87.17% |
| Average $ gain per year | +$8,717 |
| Monthly Analysis (per $10,000 traded) | |
| Average % gain per month | +7.68% |
| Average $ gain per month | +$768 |
| Monthly win rate | 76.00% |
| Trade Analysis (per $10,000 traded) | |
| Total Num Trades | 916 |
| Trades With > 5% Loss | 84 |
| % Trades With > 5% Loss | 9.17% |
| Trade Win Rate | 80.79% |
| Portfolios Which Use the Iron Condor | |
| S&P Crusher v2 | Yes |
| The Swing Trader | No |
| Period Analyzed | |
| Historical period analyzed | May 1, 2003 – Oct 31, 2016 |
| Slippage & Commission Used in Analysis | |
| Commission used in all reports (Options Trade) | $20.00 per Leg of Iron Condor (all-in) |
| Protection used in all reports (ES) | $12.50 per Leg of Iron Condor |
| Draw-Down (per $10,000 traded) | |
| Worst percent draw-down (closing trade to closing trade) | -53%** |
| Period Seen | 10/31/14-11/31/15 |
| Iron Condor | |
| Instrument traded | Weekly Calls & Puts on S&P 500 Emini Futures (ES) |
| Type of option traded | Sells OTM Call & Put, Buys deeper OTM Call & Put |
| Day of the week trade can be initiated | Monday-Thursday |
| Exit criteria | Holds till Fridays Expiration |
| Outperforms in | Drifting Up & Sideways moving markets |
| Ability to hold overnight | Yes |
| Ability to hold over the weekend | No |
| Account Details | |
| Minimum account size | $10,000 (Recommended Minimum of $20,000) |
| Allocation | One contract traded on each algorithm (1 total) per $10,000 |
| Number of algorithms traded | 1 |
| Instrument traded | ES |
| Trades Futures | No |
| Trades Options | Yes (Iron Condors) |
| Account types allowed | Cash, IRA, Roth IRA |
| Pricing | |
| Licenses available | Yes |
| Licensing fee | Call or Contact Us for a quote |
CFTC RULE 4.41: Results are based on simulated or hypothetical performance results that have certain inherent limitations. Unlike the results shown in an actual performance record, these results do not represent actual trading. Also, because these trades have not actually been executed, these results may have under-or over-compensated for the impact, if any, of certain market factors, such as lack of liquidity. Simulated or hypothetical trading programs in general are also subject to the fact that they are designed with the benefit of hindsight. No representation is being made that any account will or is likely to achieve profits or losses similar to these being shown. In other words, this package trades both the futures and the options on futures. Backtesting an options algorithm poses many challenges due to the unknown estimates for premium collected. Depending on (among other things) market volatility, the premium collected when selling an option can vary greatly. In general, the higher the volatility, the more premium we might expect to collect. In addition, ES Weekly Options were not available to trade for the entire backtested period. In order to provide our customers with more accurate back-tested data we can, we have created estimates of premium broken down by Day (Mon-Thu) and used a look-up table for various ranges of the VIX (refer to the Iron Condor product page for details). Please note, these estimates have significant limitations and the corresponding reports which use these estimates should be considered to be much less than perfect. All back-testing has limitations, however back-tested options algorithms have even more in our opinion due to the potential inaccuracies used in determining premium collected estimates.
Iron Condor Weekly Options Trade List: Trading $10,000 (1 Unit)
Data assumes $10,000 starting account, trading 1 Unit. Includes protection & commission. Results are taken from compiled back-tested/hypothetical accounts which have limitations (see CFTC RULE 4.41 below).
CFTC RULE 4.41: Results are based on simulated or hypothetical performance results that have certain inherent limitations. Unlike the results shown in an actual performance record, these results do not represent actual trading. Also, because these trades have not actually been executed, these results may have under-or over-compensated for the impact, if any, of certain market factors, such as lack of liquidity. Simulated or hypothetical trading programs in general are also subject to the fact that they are designed with the benefit of hindsight. No representation is being made that any account will or is likely to achieve profits or losses similar to these being shown.
Start Auto-Trading Today With The Iron Condor
Start using this weekly options trading strategy as a stand alone options trading algorithm or as part of the S&P Crusher Automated Trading System.