Moving Average Price Crossing Trading Strategy: INTC Shorter Term Swing Trade
Applying the Moving Average Price Crossing strategy to INTC using 60 Minute CandlesMoving Average Price Crossover System: Equities
Trade Entry/Exit Rules
Stop Settings:
No Stop Used
Limit Settings:
No Limit (target) Used
Buy Trigger(s):
New Close Above Moving Average
Sell Trigger(s):
New Close Below Moving Average

LONG Entry Results: Swing Trade (shorter term)
| Simulation Setting | |
| Asset Type | Equities |
| Symbol | INTC |
| Start Date | 03/06/1991 |
| End Date | 07/31/2017 |
| Trading Session Time | 930EST to 1600EST |
| Trading Application | Swing Trade (shorter term) |
| Candle Size | 60 Minutes |
| Direction | Long |
| Moving Average Type | SMA |
| Moving Average Length | 235 |
| Performance Metric | |
| Profit Factor | 1.14 |
| Net Profit ($) | $2108.00 |
| Gross Profit ($) | $17112.00 |
| Gross Loss ($) | $-15004.00 |
| Total Trades | 631 |
| Average Gain/Trade | $3.34 Per Trade |
| Percent Profitable | 16.48% |
| Maximum Drawdown | $-4551.00 |

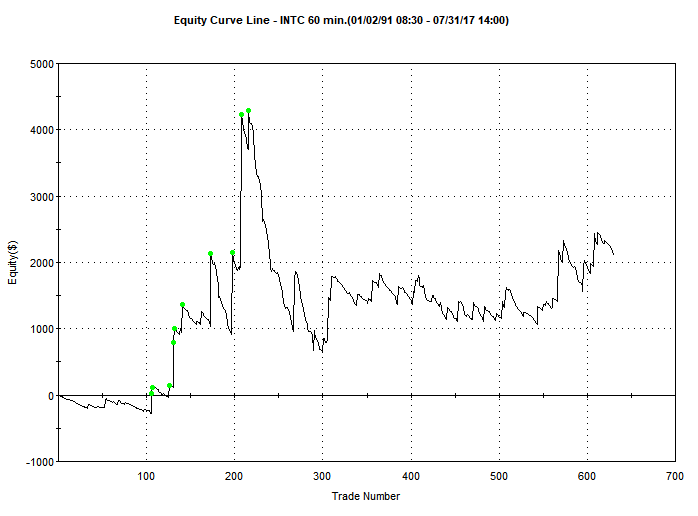
Trading Strategy Analysis
This is a great example of how different the market indexes can trade compared to individual stocks. When this strategy is applied to the S&P 500 using 60 minute candles (for a shorter term swing trade), the performance is actually decent and worthy of further analysis. When the same settings are applied to an individual stock (such as INTC), the results are not as good. Even if a reoptimization is performed as was the case here.
The profit factor is simply too low for this strategy to be considered for additional analysis.
[addtoany]