Moving Average Trading Strategy: Price Crossover – Sorting Fact from Fiction
In technical analysis, there is no doubt that Moving Averages are probably the most commonly used technical indicator. There are numerous strategies that can be implemented using just a single moving average. Probably the most simple and common one being the Moving Average Price Crossing trading strategy. If you’ve ever read a book on technical analysis, more than likely you’ve seen this strategy mentioned.
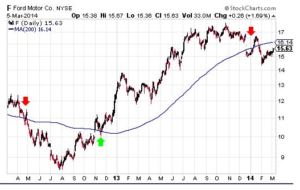
There is consistency in the strategy entry/exit rules – across multiple sources. A few are included below:
The question is, do they work?
Performance vs Asset Traded
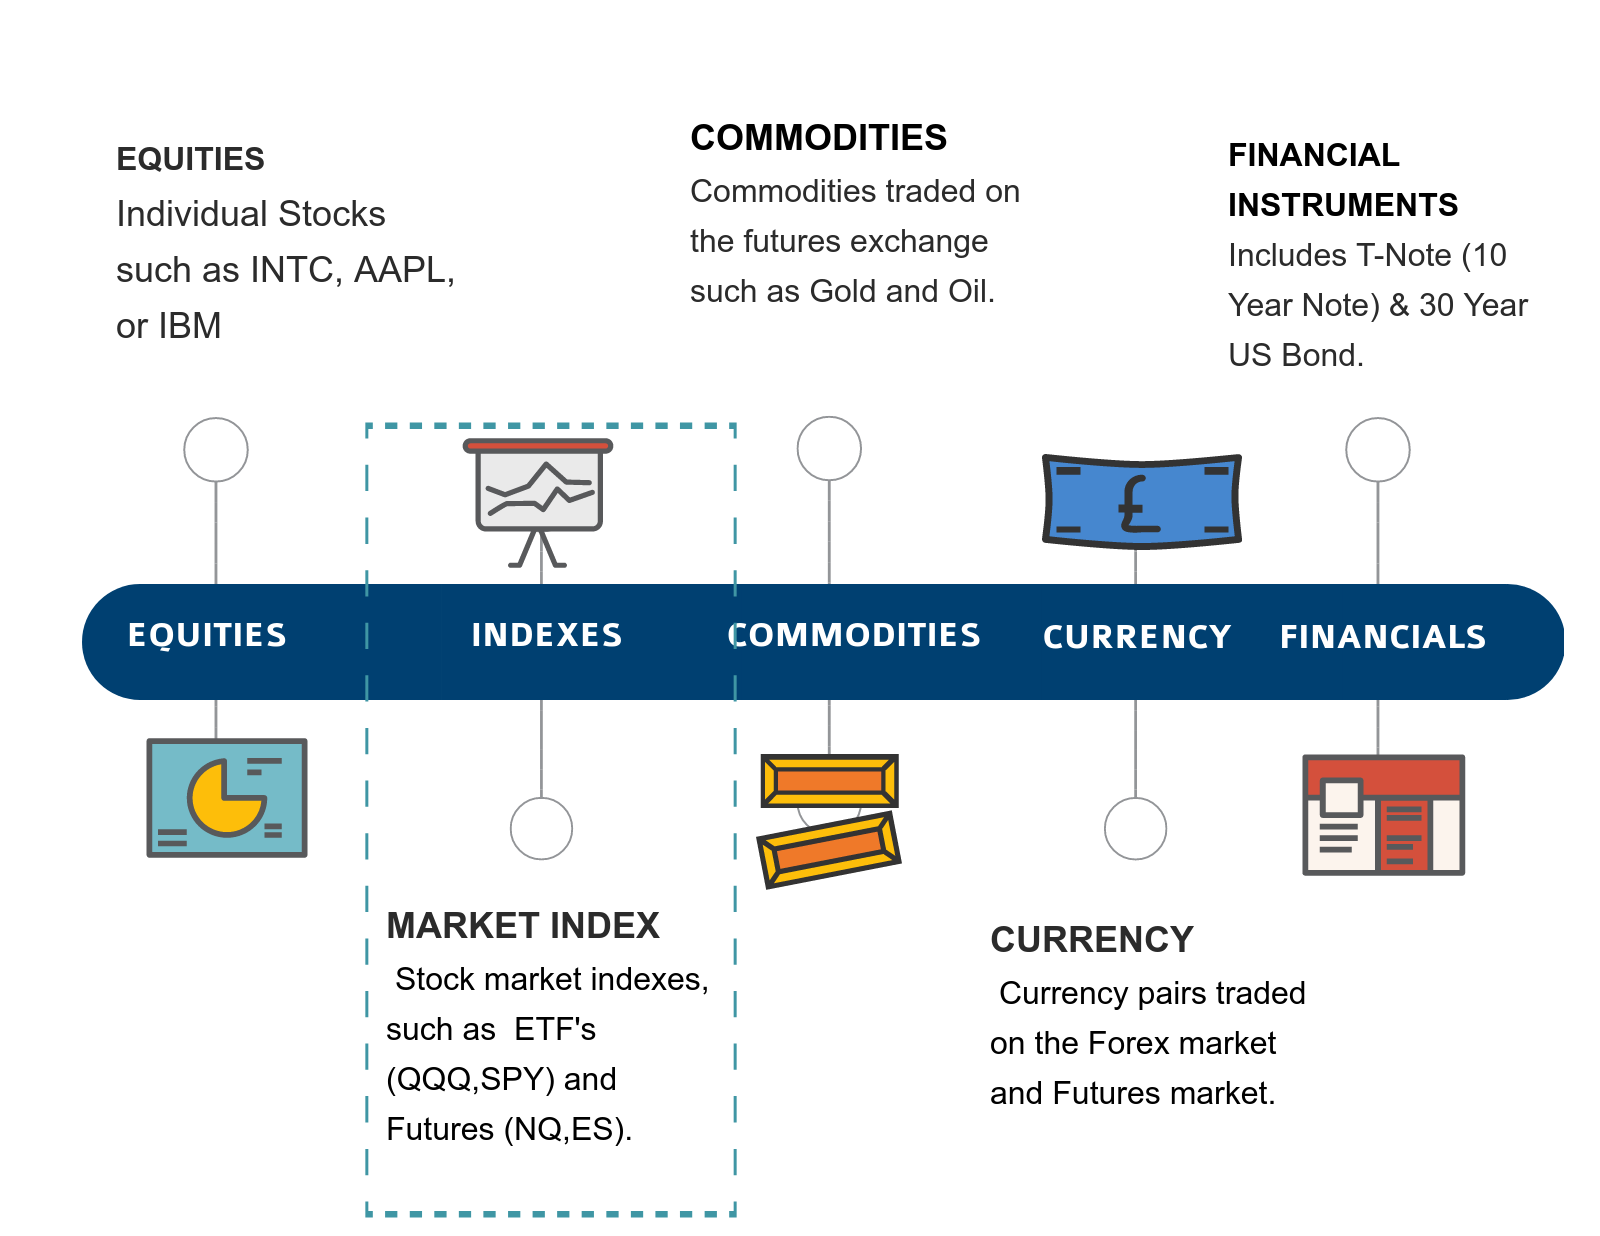
There are multiple assets which this strategy could be applied to or tested on. For the purpose of this study, we will be analyzing this strategy when applied to market indexes.
It is AlgorithmicTrading.net’s opinion that this analysis and data gleaned from this study could apply to any Index that has a moderate bias to the upside, both futures (NQ,ES) and equities (QQQ, SPY). This distinction is being made in order to simplify the study and to provide actionable information as it pertains to swing trading the indexes.
Performance of any trading system can vary based on the asset traded. The simplest way to explain this is by comparing an Index (such as the S&P 500) to an individual stock (such as Intel Corp). The stock’s price can move drastically based on a negative earnings report, litigation against the company or some other black swan event. A stock market index will typically trade with lest volatility due to the diversity which makes up this asset.
Performance vs Trading Style
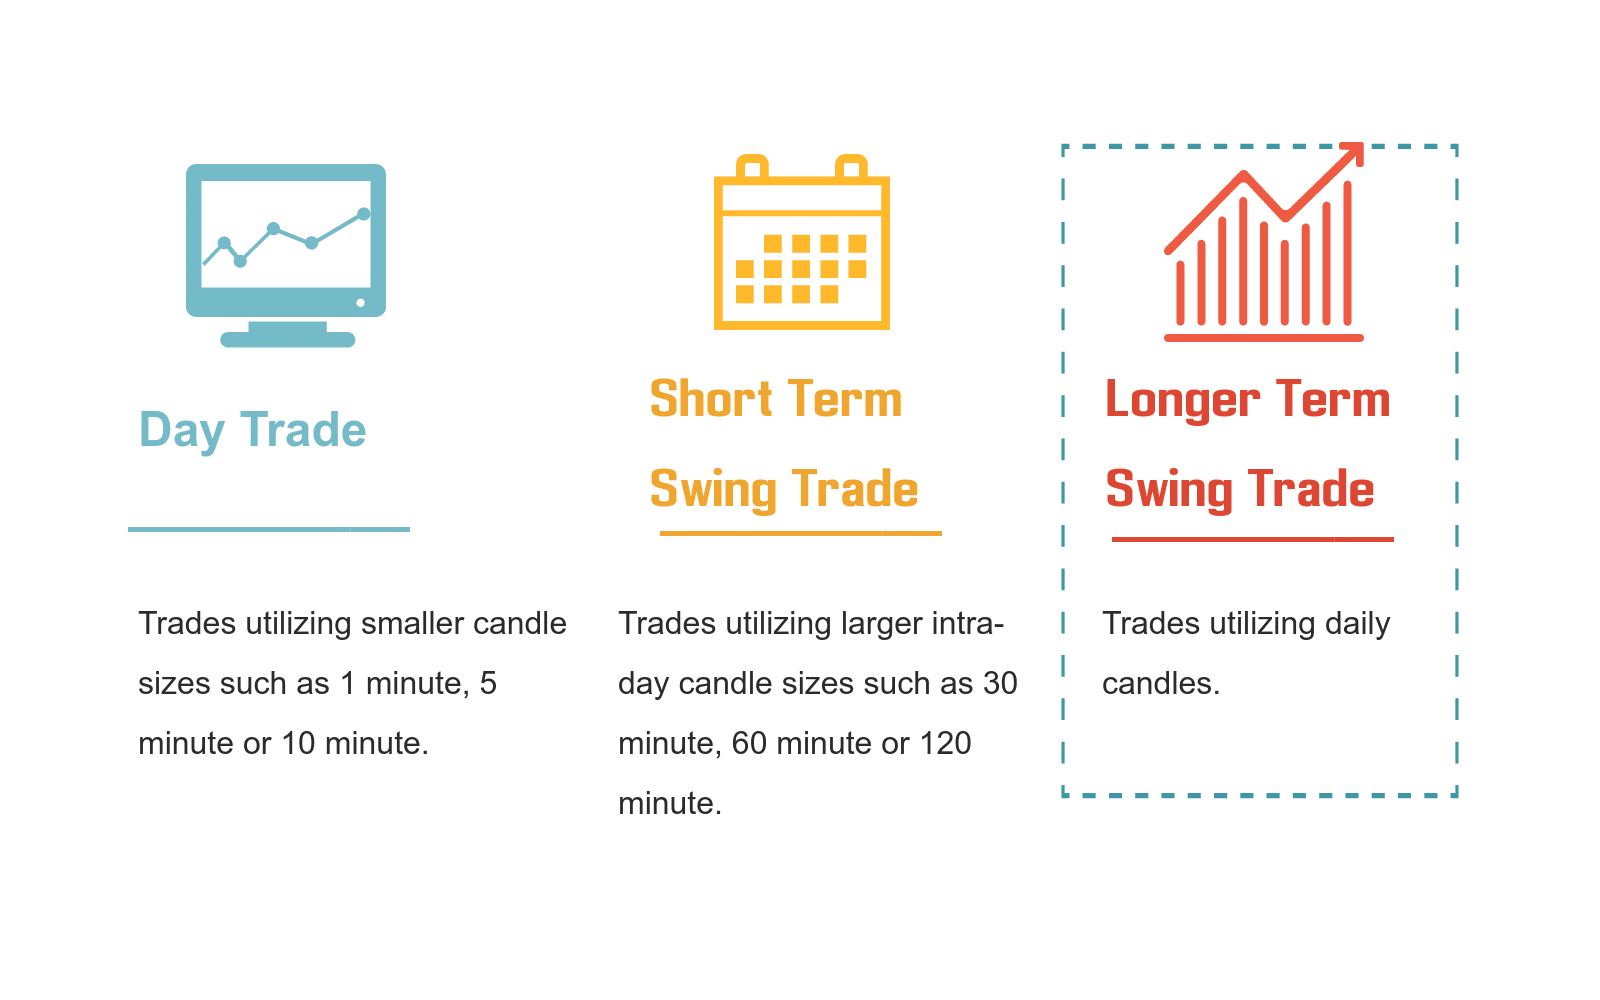
For the purpose of this study, we will be analyzing this strategy in the context of a Longer Term Swing Trading. The style of trading can have a substantial impact on any trading system. A system that performs well on daily charts might not perform as well when run as a day trade or shorter term swing trade. Most day-trading algorithms have a larger number of trades and because they hold for a shorter duration, they typically have smaller average gain/trades.
In order to provide an accurate analysis and give this strategy a fair shot at success, we will focus on the most common style used when this Moving Average Price Crossing strategy is mentioned online and in educational trading material. Namely, in the context of a longer term swing trade.
A Quantitative Trading Approach
In order to determine the validity of the Moving Average Price Crossing strategy, we will employ a quantitative analysis technique that will shed some light into the validity of this system. As mentioned above, this will be in the context of a Longer Term Swing Trade on a Market Index (such as the S&P 500 Emini Futurs).
We will follow the process outlined below as a first step.
Phase 1 Analysis: Back-Testing
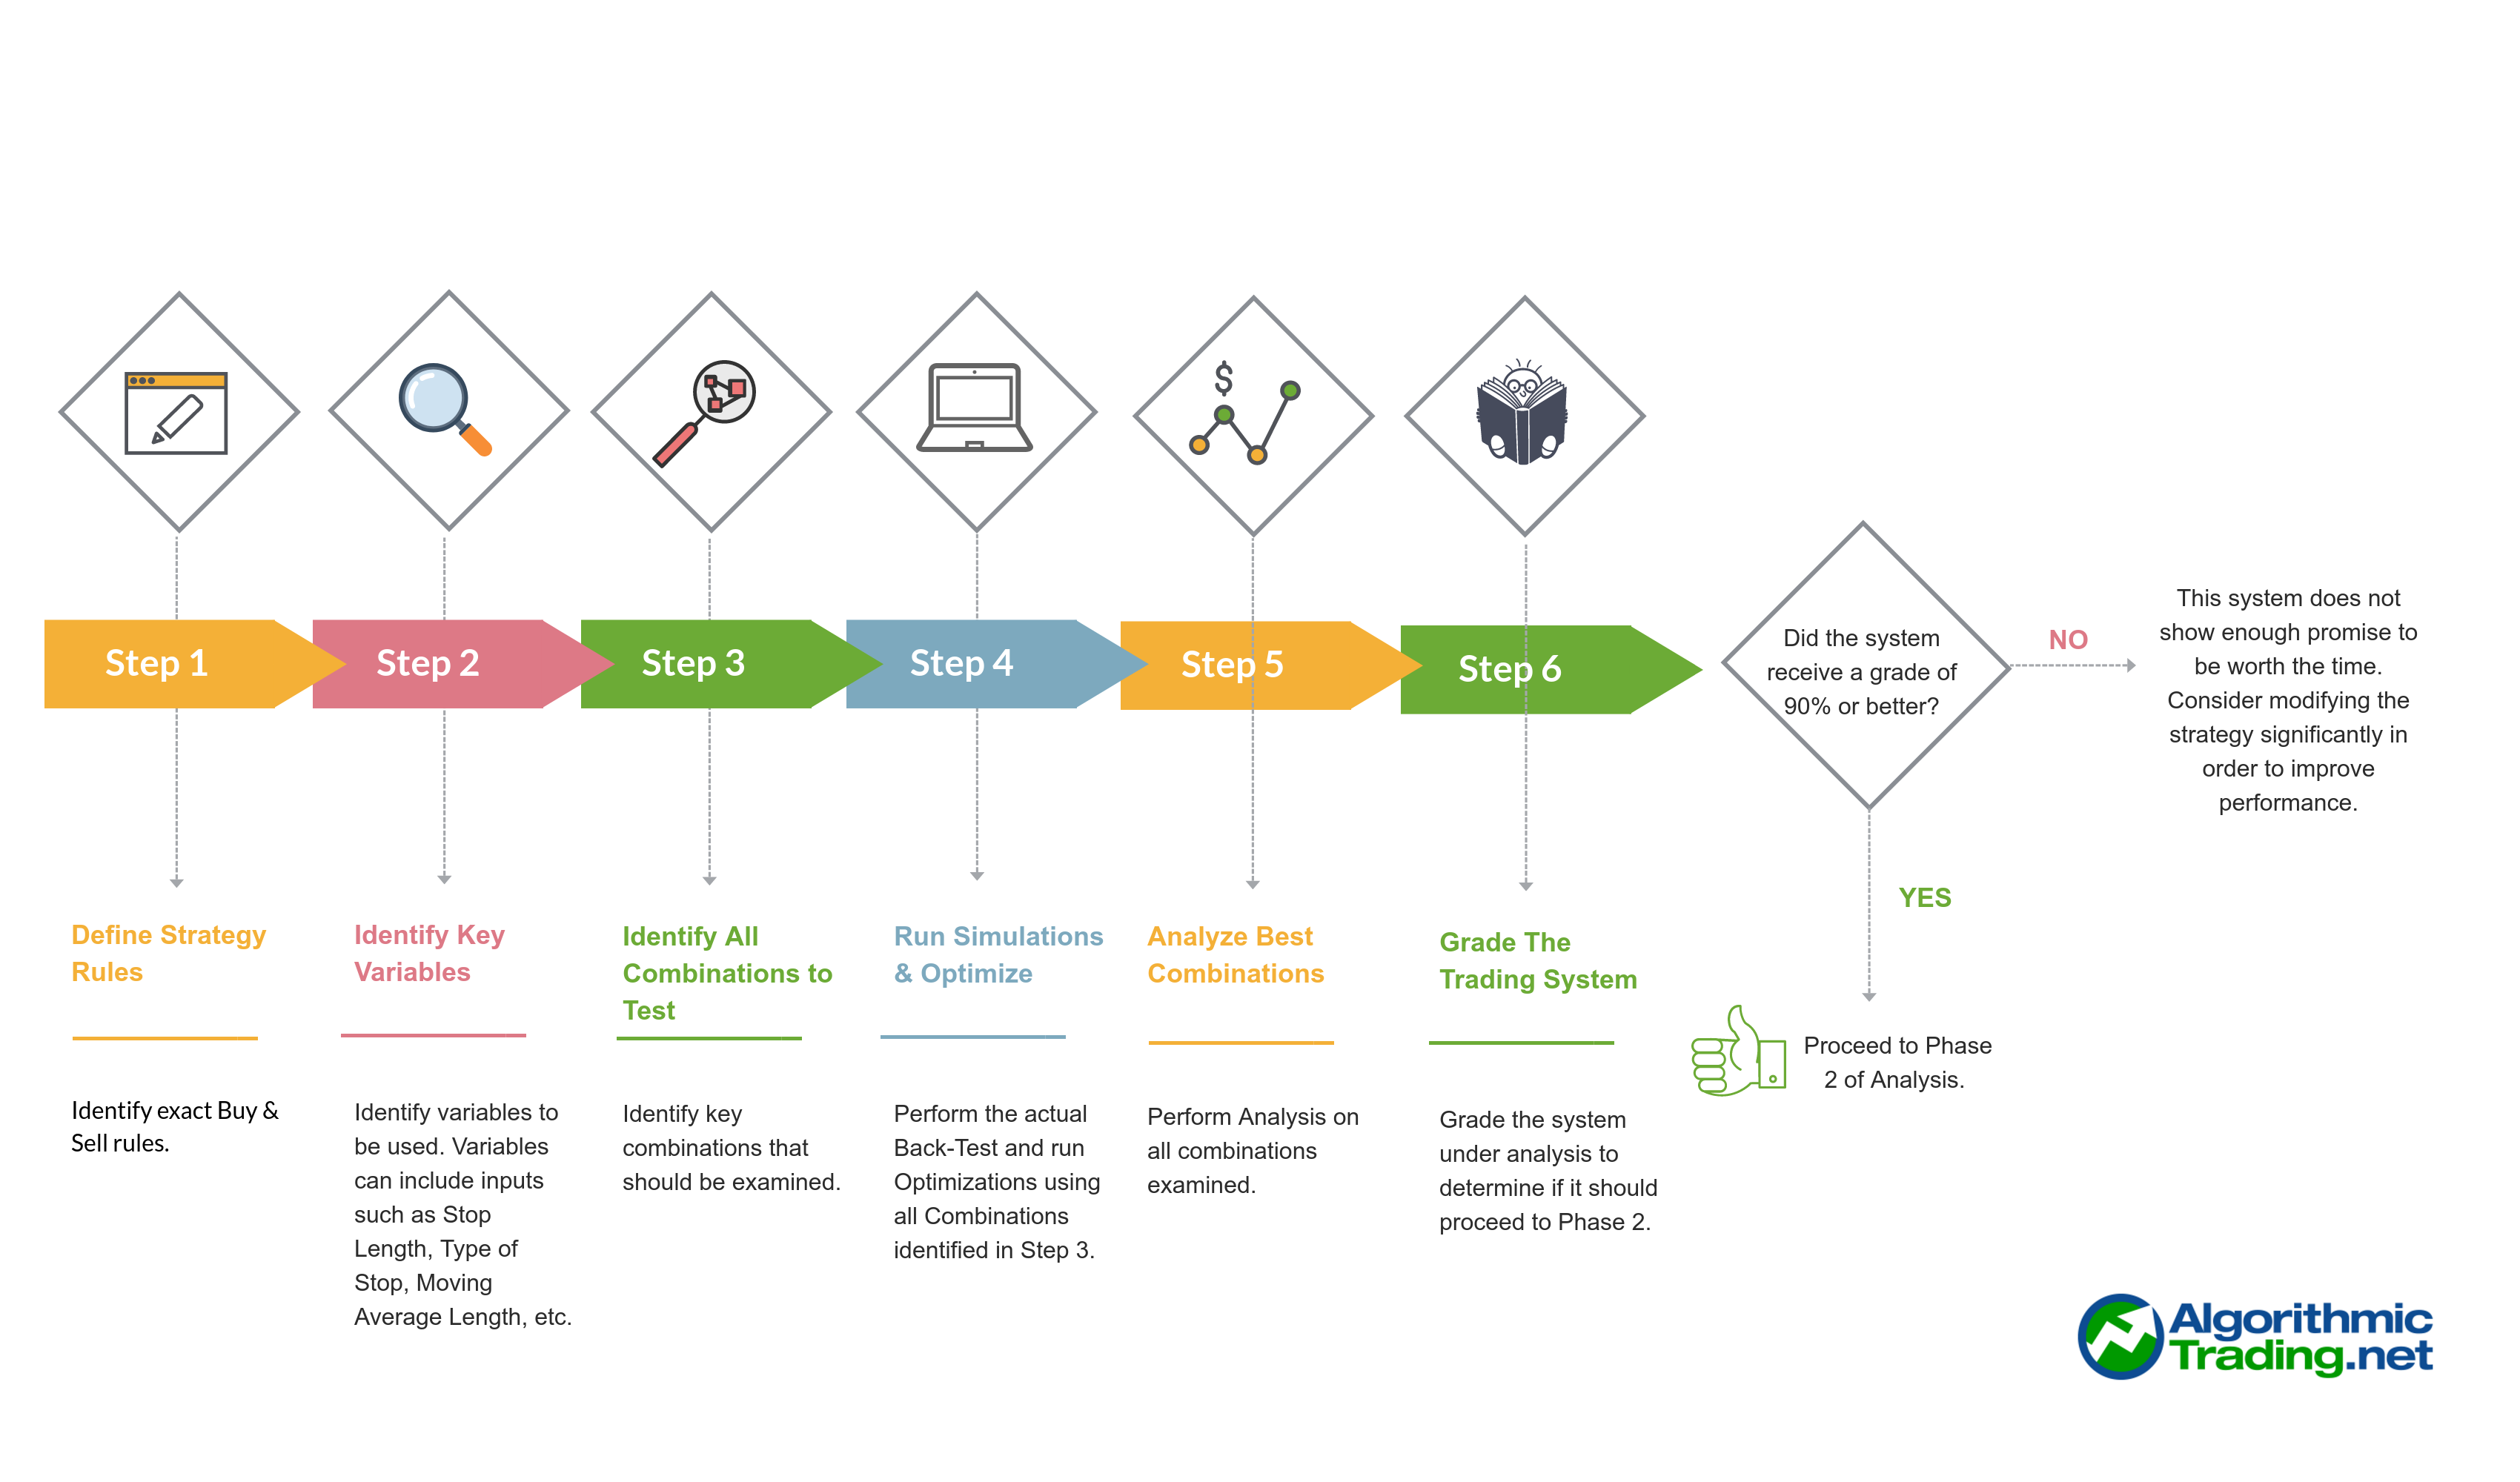
The first step in our quantitative analysis methodology is to run the trading strategy through our back-testing flow. In this flow, we identify the strategy to test, the variables (inputs) into the algorithm, run the simulations and analyze the data. We expect to see consistent data as inputs are modified. If the strategy passes our initial design criteria with a passing AlgoGrade of 90% or better, we will run the algorithm through Phase 2 Analysis: Walk-Forward Testing.
For the purpose of this analysis, we will be focusing on Phase 1 which follows these 6 steps.
Step 1. Define the Strategy
Moving Average Price Crossover – Long Trades
Enter trade when price closes above the moving average. Exit the trade when price closes below the moving average.
Stops & Limit Orders Used
In order to stay consistent with the most common descriptions you will find for this strategy, we will not be using any Limit Exit orders or Stop orders.
Step 2. Identify Key Variables & Questions
Variable #1: Simple Moving Average vs. Exponential Moving Average
A simple moving average (SMA) is the unweighted average of the previous n closing periods. N is defined as the number of closing periods used in the computation and is referred to as the Moving Average Length. Most charting software will automatically compute the SMA and add it to a chart – similar to the following picture which shows a 50 Day Simple Moving Average (SMA) applied to a chart of the S&P 500 Emini Futures (ES).
An exponential moving average (EMA) also known as an Exponentially Weighted Moving Average (EWMA) is an exponentially weighted average of the previous n closing periods. More recent closing prices are weighted heavier than older closing periods providing an average that is faster to respond to changing prices.
Question: Does using an EMA provide a benefit over SMA?
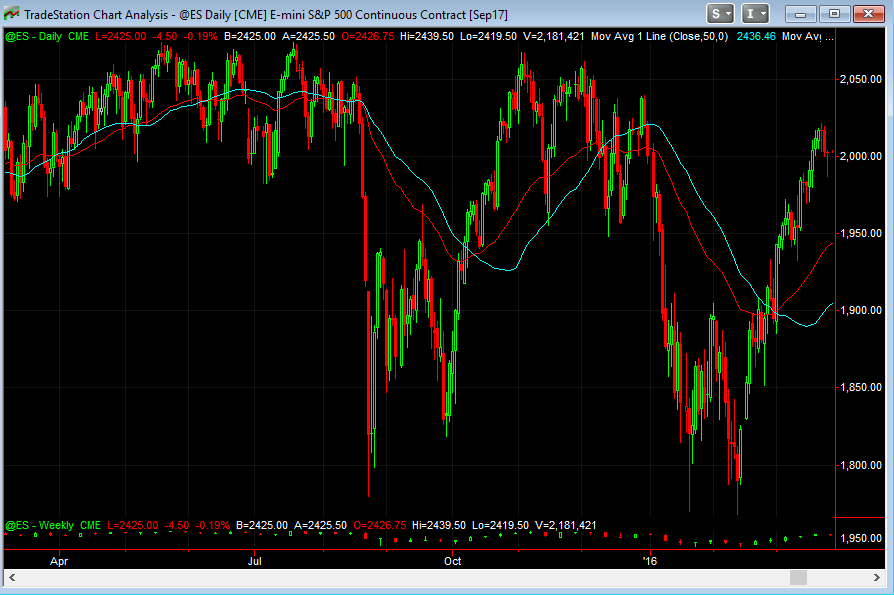
The following picture shows a 50 Day Simple Moving Average (SMA; in Blue) and 50 Day Exponential Moving Average (EMA; in Red) applied to a chart of the S&P 500 Emini Futures (ES).
Popular Theories on SMA vs. EMA
The allure of an Exponential Moving Average is something that we have all felt. Doesn’t it make sense to weight the more recent price moves more than older ones? The thought is that in doing this, you can get a jump on the move before it actually happens. Here’s what others have said:
Variable #2: Moving Average Length
Adjusting the length of the Moving Average can substantially modify the signals one might get while using this technical indicator. For example, a 200 Day Moving Average will be much slower to move and will generate far fewer trading signals. Alternatively, a shorter length (such as a 5 Day Moving Average) will change direction much faster since it’s only taking into account the preceding 5 Days of data.
Question: How does modifying the length of the Moving Average modify the performance of any given Moving Average based Trading System?
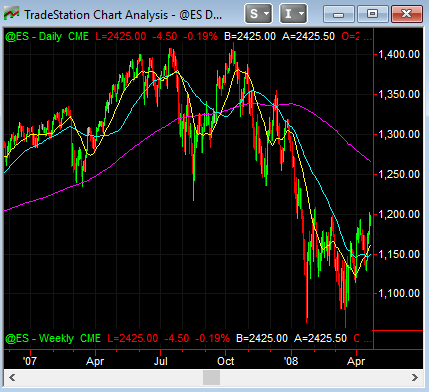
The above picture shows a 20 Day, 50 Day & 200 Day Simple Moving Average applied to a chart of the S&P 500 Emini Futures (ES).
Popular Theories Regarding Moving Average Lengths
For one trader, the 200 Day is the key. For another, the 50 Day moving average. Still others suggest you should use the 20 Day Moving Average. There is an appeal to using a shorter length – because it does allow you to get in on larger trends quicker. Of course the trade off is that there are potentially more false signals.
Variable #3: Symbol, Candle Size & Long vs. Short
Anyone who has coded a trading strategy knows all too well that any given strategy can behave differently based on the asset traded and durations used. For example, one system might run better on 5 minute candles than it would on 60 minute or daily candles. In order to create a robust analysis – it is not sufficient to look at one index or one stock, with one time period. For the purpose of this study, we will be analyzing the S&P Emini Futures (ES) using daily candles. The strategies will be separated into two distinct systems, one for Long trades and the other for Short trades. This provides the trader with much more flexibility in that they can trade Long only, Short only or both concurrently.
Why the S&P 500 Eminis (ES)?
It is our opinion that in order to give the strategy a fair shot at producing a reliable system, we should use an Index as our Asset to trade (instead of a stock or commodity). Index Futures are far more stable than a stock which could have a sudden and massive unexpected move due to a bad earnings announcement, litigation or some other catastrophic event. The S&P 500 (ES) is the most actively traded futures instrument traded and therefore it was selected instead of the Russel, NASDAQ or Dow Futures.
Why daily candles?
Most books that mention the Moving Average Price Crossing strategy reference it in the context of daily charts. It should be noted, many day trading books also mention this strategy – but do so in the context of primarily 5 or 10 minute candles. Using the daily candles should produce better results than what we might see while using intraday candles, therefore it is our opinion that we are setting this test up for the best chance at producing a trade-able strategy.
Why separate Long & Short trades?
In order to setup the best possibility for success – we will measure the success of each algorithm as either a Short or Long trading system. In essence, we will run the optimizations once for Long only trades and then a second time for Short only trades. By separating the Long strategy from the Short strategy, we can utilize different variables (ie,Moving Average Length) for the short and long cases. Both algorithms could run concurrently, creating a combined Long/Short strategy without any issues.
Step 3. Identify Combinations to Test
Putting It Together: Possible Strategy Combinations
The following table demonstrates how quickly the number of tests run can increase. For each option added, the total number of tests run doubles. In this extremely simple analysis, our number of tests is quite small.
Combinations of MA Type & MA Length to Run
| Test # | MA Type | MA Length |
| 1 | SMA | 5 |
| 2 | EMA | 5 |
| 3 | SMA | 10 |
| 4 | EMA | 10 |
| … | … | … |
| 117 | SMA | 295 |
| 118 | EMA | 295 |
| 119 | SMA | 300 |
| 120 | EMA | 300 |
Run for Long Only Trades, then Run Again for Short Only Trades
Step 4. Run Simulations
Run an optimization for both the Long Strategy & the Short Strategy. Allow Tradestation to loop through all possible cases and determine the best MA Type (EMA vs SMA) and Moving Average Length (between 5 and 300 day, in 5 day increments). This is where Quantitative Traders have an enormous edge. They are able to examine 100’s of possible combinations in seconds. This same work done manually would take weeks to perform accurately and would potentially suffer from developer bias.
By allowing the computer to process through each potential trade using mathematically defined rules – there is no ambiguity. The trading algorithm will analyze trades with the rules given and no trades will be missed if this is done properly.


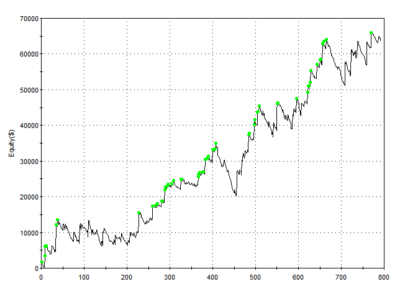
Screen shot of Tradestation Optimizations being performed. Each possible combination is examined for the period of time indicated on the chart. Once simulations are completed, tradestation will indicate which combination of variables was most profitable. For examle, SMA with 200 day length – or perhaps EMA with a 10 Day Moving Average Length.
Step 5. Present & Analyze Best Combinations Found
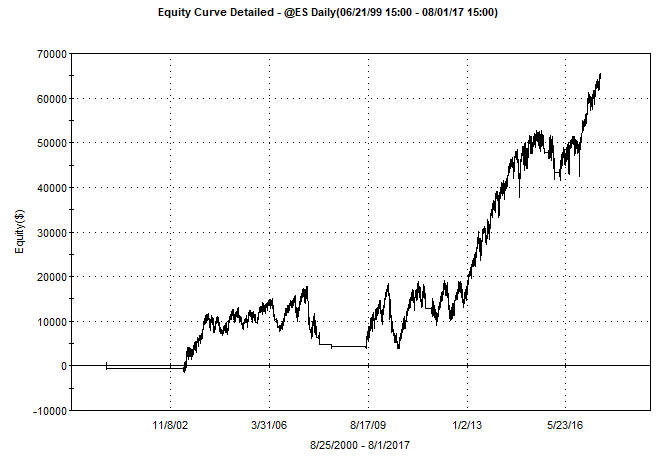
LONG Entry Results
| Simulation Setting | |
| Asset Type | Futures |
| Symbol | @ES |
| Start Date | 08/25/2000 |
| End Date | 08/01/2017 |
| Trading Session Time | Regular Session Hours |
| Trading Application | Swing Trade (longer term) |
| Candle Size | 1 Day |
| Direction | Long |
| Moving Average Type | EMA |
| Moving Average Length | 220 |
| Performance Metric | |
| Profit Factor | 2.39 |
| Net Profit ($) | $47,460.00 |
| Gross Profit ($) | $81,712.50 |
| Gross Loss ($) | -$34,252.50 |
| Total Trades | 53 |
| Average Gain/Trade | $895.47 Per Trade |
| Percent Profitable | 28.30% |
| Maximum Drawdown | -$14,188.75 |
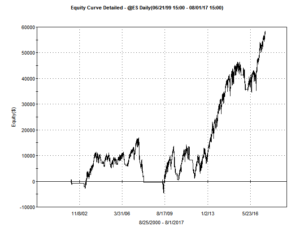
Click on the above picture to zoom in. Note the lack of trades during 2008 when the markets faced extreme downside pressure.
Trade Entry/Exit Rules
Stop Settings:
No Stop Used
Limit Settings:
No Limit (target) Used
Buy Trigger(s):
Moving Average #1 Close Above, New Close Only
Sell Trigger(s):
Moving Average #1 Close Below, New Close Only
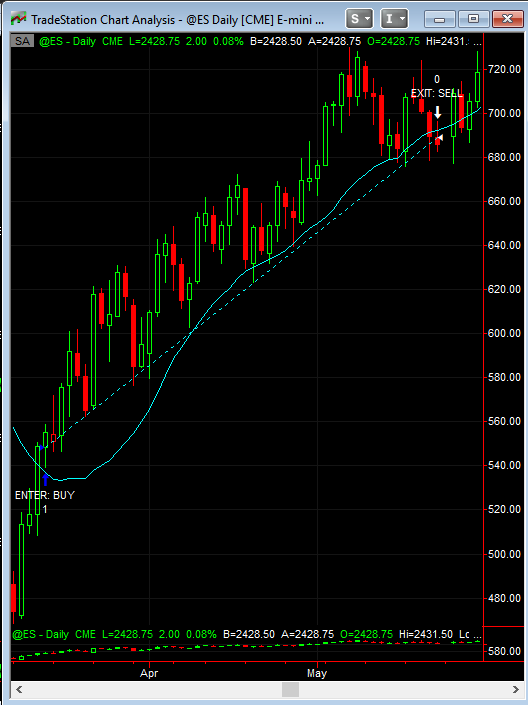
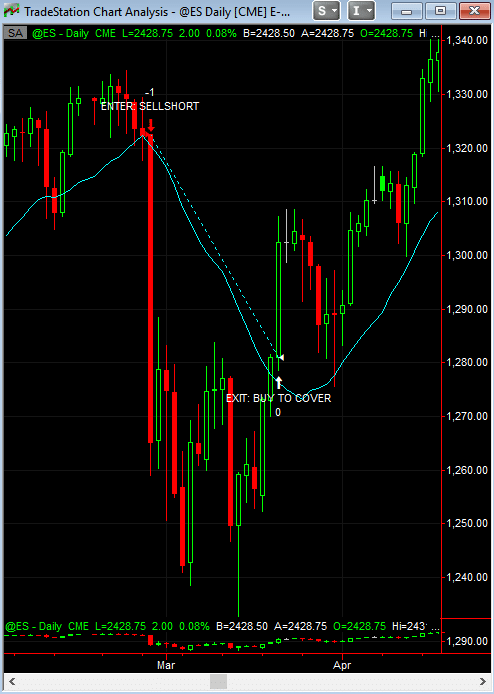
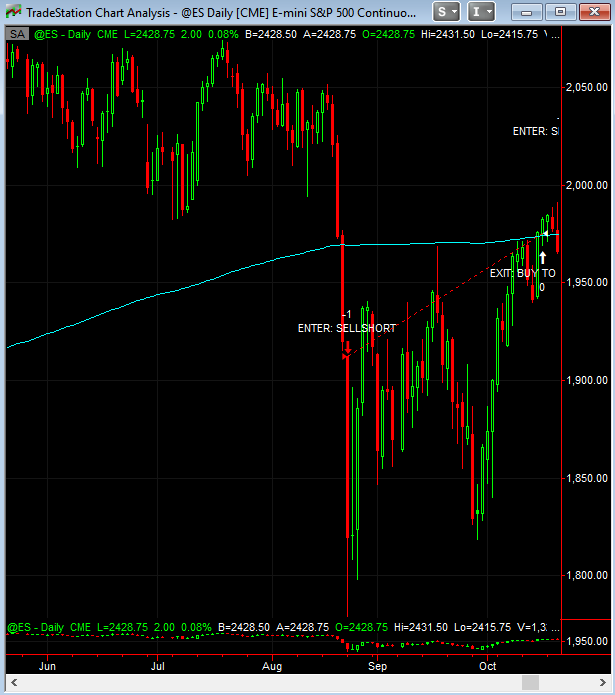
Pictures of Trade Entry, Exit, Profitable Trade and Losing Trades
Question: How does this strategy perform with a 20 Day MA?
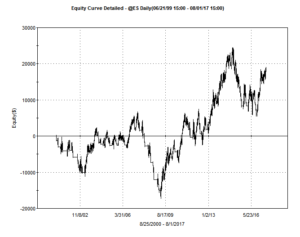
Question: How does this strategy perform with a 50 Day MA?
Question: How does this strategy perform with a 200 Day MA?
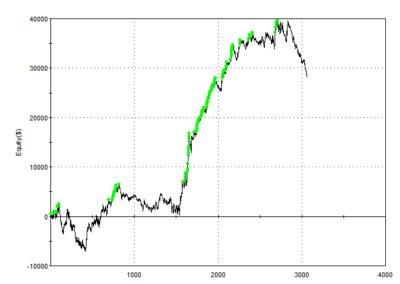
The following EC shows that using a 200 Day moving average is even better, however the numbers are still not good. This strategy would have toggled between gains and losses between 2003 – 2013 before finally breaking out of it’s range. Again, if the goal is to outperform the S&P 500, this strategy is simply not good enough.
It should be noted, this equity curve does show a glimmer of hope. This could possibly be the foundation of another system that might use this trade sequence as either a confirmation signal or as part of a sequential algorithm that might look for multiple events to occur in a specific order.
CFTC RULE 4.41: Results are based on simulated or hypothetical performance results that have certain inherent limitations. Unlike the results shown in an actual performance record, these results do not represent actual trading. Also, because these trades have not actually been executed, these results may have under-or over-compensated for the impact, if any, of certain market factors, such as lack of liquidity. Simulated or hypothetical trading programs in general are also subject to the fact that they are designed with the benefit of hindsight. No representation is being made that any account will or is likely to achieve profits or losses similar to these being shown.
SHORT Entry Results
| Simulation Setting | |
| Asset Type | Futures |
| Symbol | @ES |
| Start Date | 08/25/2000 |
| End Date | 08/01/2017 |
| Trading Session Time | Regular Session Hours |
| Trading Application | Swing Trade (longer term) |
| Candle Size | 1 Day |
| Direction | Short |
| Moving Average Type | SMA |
| Moving Average Length | 295 |
| Performance Metric | |
| Profit Factor | 1.48 |
| Net Profit ($) | $17,292.50 |
| Gross Profit ($) | $53,127.50 |
| Gross Loss ($) | -$35,835.00 |
| Total Trades | 39 |
| Average Gain/Trade | $443.40 Per Trade |
| Percent Profitable | 5.13% |
| Maximum Drawdown | -$38,602.50 |
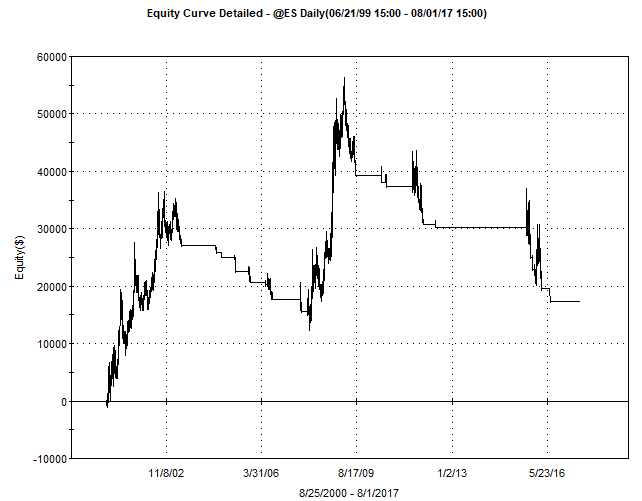
Click on the above picture to zoom in. Note the volatility in performance.
CFTC RULE 4.41: Results are based on simulated or hypothetical performance results that have certain inherent limitations. Unlike the results shown in an actual performance record, these results do not represent actual trading. Also, because these trades have not actually been executed, these results may have under-or over-compensated for the impact, if any, of certain market factors, such as lack of liquidity. Simulated or hypothetical trading programs in general are also subject to the fact that they are designed with the benefit of hindsight. No representation is being made that any account will or is likely to achieve profits or losses similar to these being shown.
How does this strategy perform utilizing other time periods and on different asset types?
As previously mentioned, any given trading strategy can have different results when modifying the candle sizes on your chart. For example, a 10 Minute chart is a typical setup for day traders. When using a 10 minute chart, the Moving Average Length will reference the closing price of each 10 minute candle. Therefore, a 200 Period Moving Average length on a 10 minute chart is vastly different than a 200 Period Moving Average length on a daily chart.
In addition, behavior will be different if one uses the trading strategy on a single stock instead of an Index such as the S&P 500 Eminis (ES). The following sortable projects demonstrate this all too well. For each case, the algorithm was applied to the chart and back-tested. The final “best results” are displayed for each setup.
Step 6. Grade The Trading System
How Good Is This Strategy?
First pass criteria include looking at Profit Factor , Maximum Drawdown and Total Number of Trades. For AlgorithmicTrading.net, if a trading systems passes an initial step of testing, we will analyze it further to include performing multiple cross optimizations, performing in-sample & out-of-sample testing using the Tradestation Walk-Forward Analysis test.
Price Crossing Moving Average Trading Strategy: LONG Entry
Very Small Number of Trades
Very High Profit Factor
Large Draw down
Low Risk of Curve Fitting
Large Average Gain Per Trade
Risk of Large Loss
Price Crossing Moving Average: Final Grade
The entry & exit rules for this strategy are explained in a consistent way – in probably every single book on technical analysis. The biggest problem with their rules is that they are almost always too vague. They leave it up to the reader to pick the chart size (5 min, 10 min, 60 min or daily) and tend to reference the 20 day, 50 day and 200 day moving averages as being good ones to use.
The Good
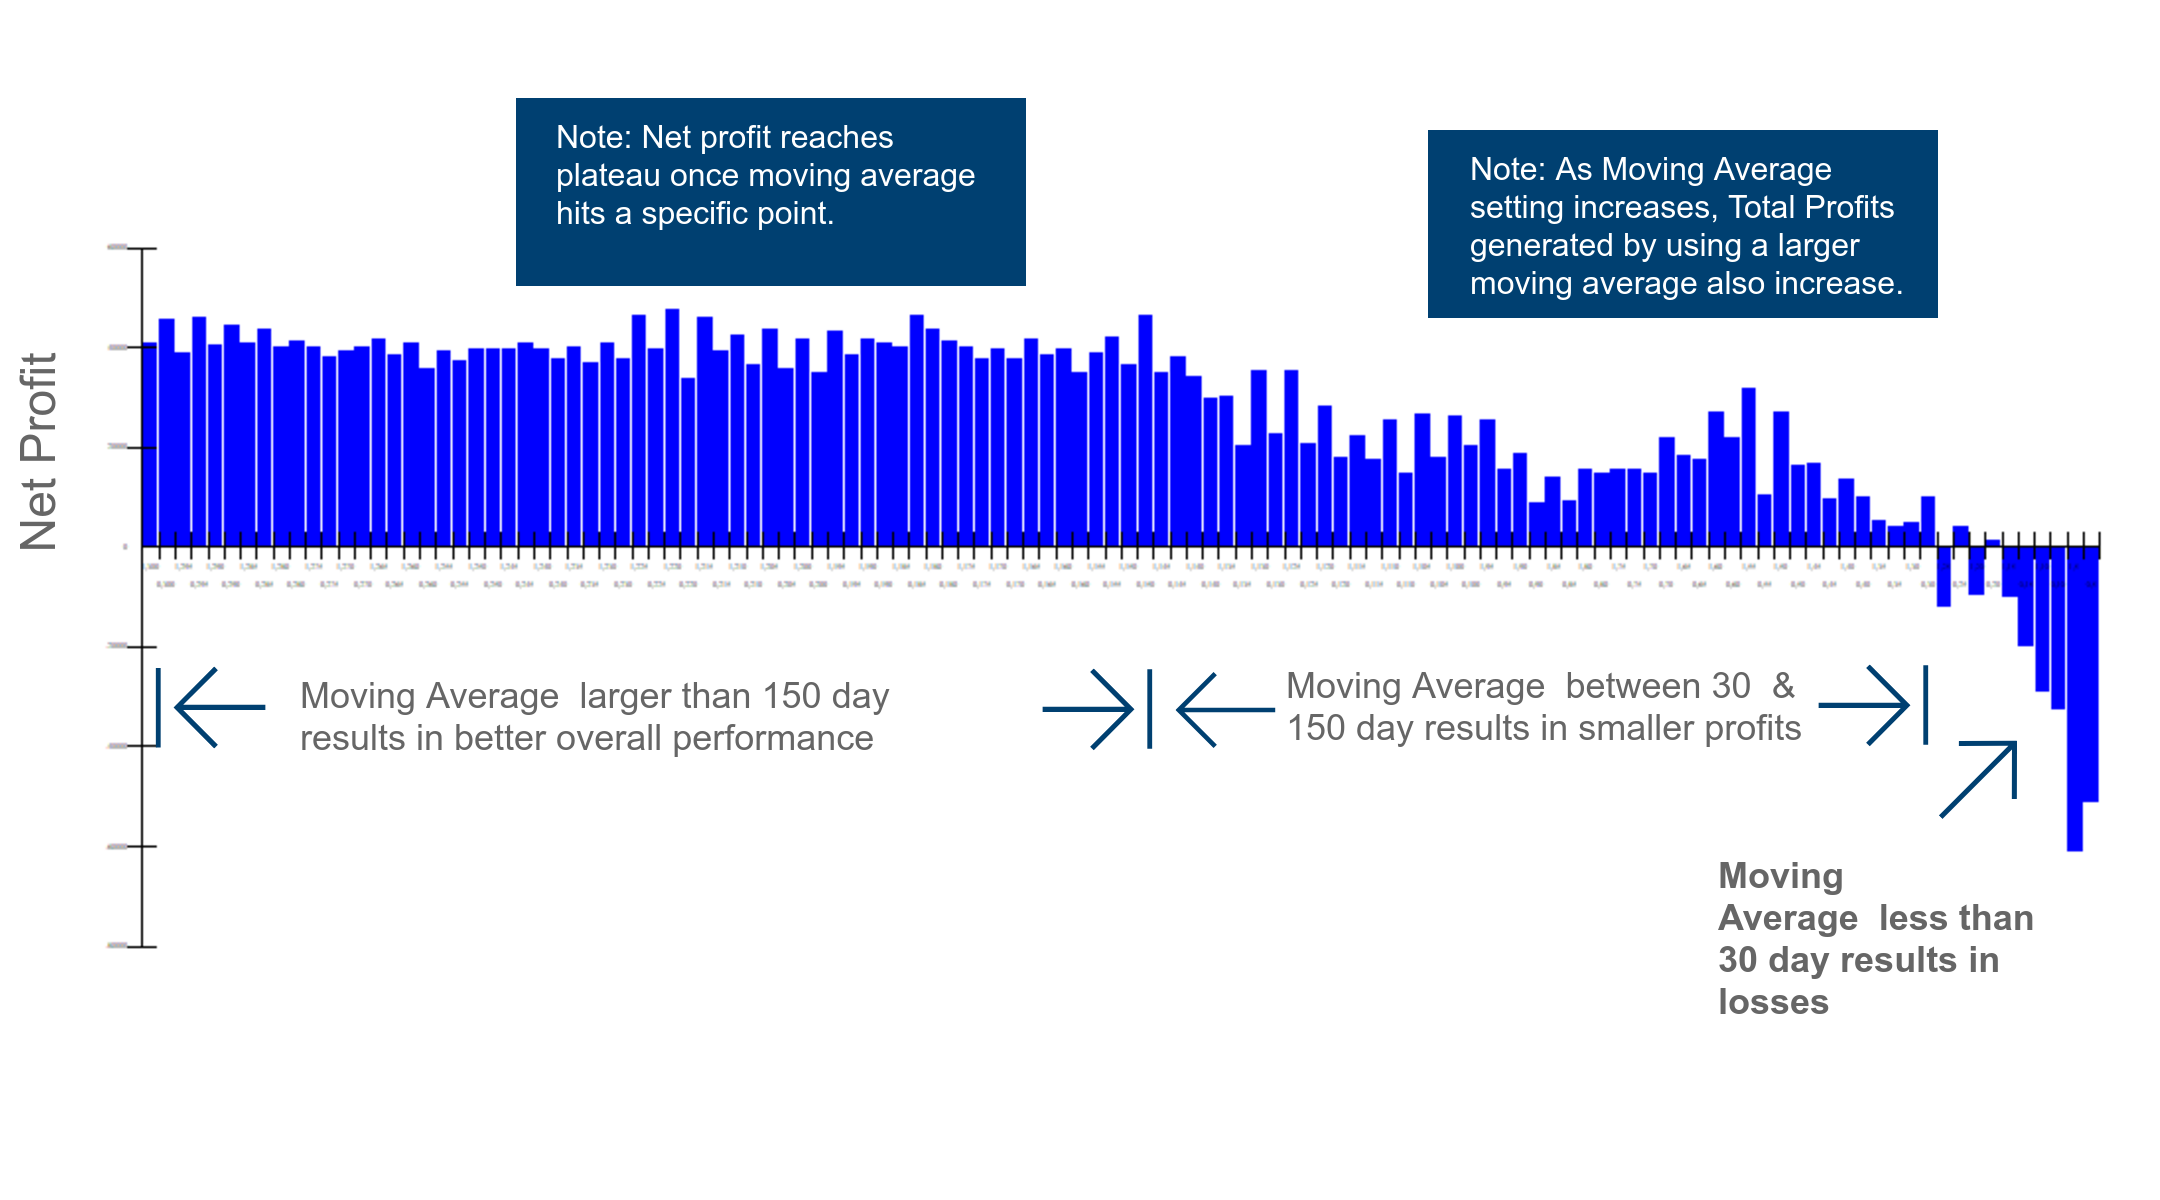
The Moving Average Price Crossover strategy is consistently defined across multiple sources. Most reference daily charts – which appear to be more reliable than using this strategy as a day trade. At least using daily charts, there is consistency with regard to the most optimal Moving Average Length. As the length increases, so do potential profits until a plateau is reached.
The Bad
The Moving Average Price Crossover strategies you will find online are good at being vague. They leave it up to the trader to determine the best Moving Average Length. Some are braver than others – referencing the 200 Day, 50 Day and 20 Day moving averages.
The Ugly
Drawdowns are too large as compared to potential gains.
Final AlgoGrader Score
Our opinion is that this strategy – as defined in this study – is not worthy of additional testing (walk-forward then live trades). While the back-testing does show gains and a fairly high profit factor, there are simply too many negatives to ignore. The primary issue being the drawdown.
%
AlgoGrader Score: D
Separating Fact from Fiction
How does modifying the Moving Average Length effect overall profitability?
The following picture demonstrates how increasing the length of the Moving Average improves performance up to a certain point.
Click on the above picture to zoom in. Up to a point, as the Moving Average Length increases, the Total Net Profit increases as well. Therefore, consider using larger Moving Average Lengths when analyzing trading systems using the Price Crossover Trading Strategy.
Does the data show using an Exponential Moving Average (EMA) is better than using a Simple Moving Avarage (SMA)?
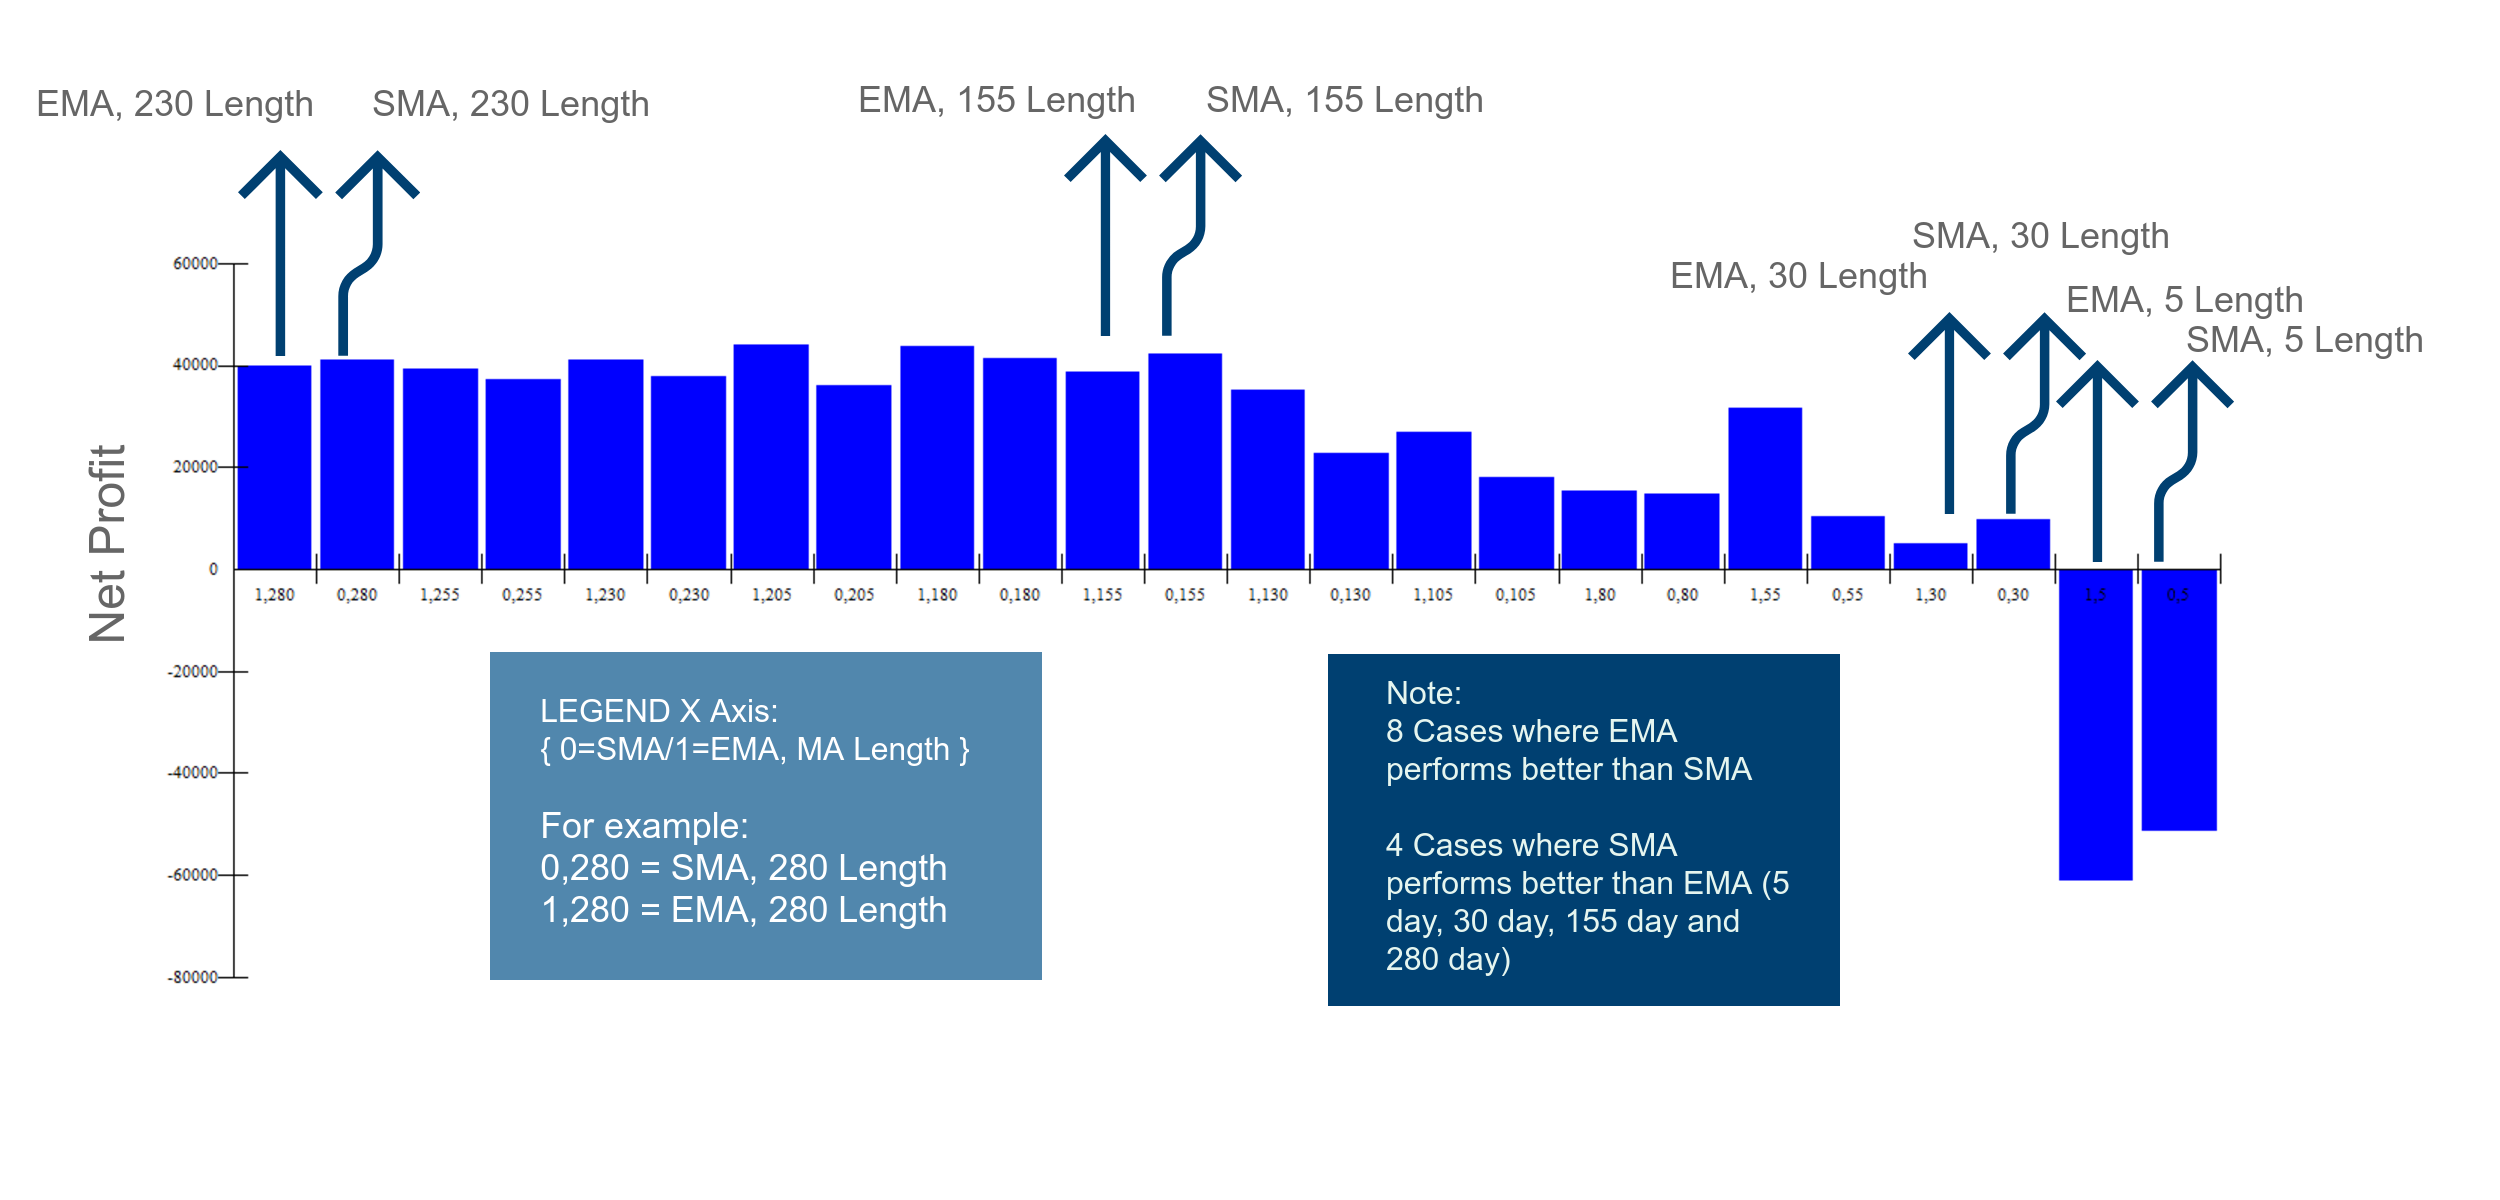
Using an Exponential Moving Average does appear to perform slightly better than using a Simple Moving Average. However, this increase in Net Profitability is fairly small and should be considered barely an improvement. In fact, a schmoo of moving averages showed that 8 out of 12 Moving Average Lengths had better performance while using the EMA. Only 4 out of 12 showed improvement while using the SMA.
Click on the above picture to zoom in. This data shows that using an EMA instead of an SMA could produce better final results.
How reliable is this claim?
This statement might be a bit too strong, it does suggest that it’s a no brainer to use the EMA vs the SMA. Since the data backs up this claim, we are labeling this as true. If given a preference between an SMA and EMA, at least in our test, it would appear that the EMA is slightly better.
In my view, there is no strong empirical evidence to support the idea that linearly or exponentially weighted moving averages provide a substantive and consistent improvement over simple moving averages.
How reliable is this claim?
This is a close call. In our opinion, the data shows that there is a slight advantage to net profitability when using the EMA vs the SMA. However, I certainly would not characterize this as strong evidence. Therefore, based on our analysis this claim is considered to be true.
How reliable is this claim?
There is some partial truth here in our opinion. Certainly the 200 Day Moving average is an indicator – however the 50 Day is on the edge. The 20 Day Moving Average is simply not a good length to use – based on our simulations. In fairness to the author, he doesn’t appear to be suggesting that this is always the case. It’s open to interpretation for sure. The problem is, most people that read this statement will read into it a bit and could make trades that are not beneficial to them. Some clarification on what is meant by “A Reaction” is needed to adequately grade this comment.
How reliable is this claim?
I would disagree that they help in making trading decisions. The data shows that the 20 day is not helpful and can actually be detrimental. The 50 Day is profitable, however the 200 Day is better. In defense of the Author, he was using this rule along with a stochastic indicator. It could be the case that in that context he is correct.
How reliable is this claim?
This graphic implies that the beginning of the “new trend” will last more than 1 day. The reality is that if someone uses the 20 Day MA as is suggested in this graphic, they will have a net losing trading system, assuming they are trading the S&P 500 Index.
Summary Of Our Findings & Best Practices
As Utilized On A Market Index
When this strategy is run on a market index such as the S&P 500 Emini Futures (ES), the following best practices apply. In addition, similar results could be expected if this strategy is applied to any other Market Index Asset such as the NASDAQ Eminis (NQ) and perhaps even market index ETF’s such as the SPY and QQQ.
Day Trading Application (10 minute candles)
- This is the worst case for all analysis done utilizing this trading strategy. Click here to see the results of this study.
- Maximum drawdown is still too high, however modifying this strategy could help improve it. For example, adding a stop loss or trailing stop loss.
Shorter Term Swing Trades (60 minute candles)
- This is the best case for all analysis done utilizing this trading strategy. Click here to see the results of this study.
- Maximum drawdown is still too high, however modifying this strategy could help improve it. For example, adding a stop loss or trailing stop loss.
Longer Term Swing Trades (daily candles)
- The larger the Moving Average Length the better, up until a certain point – where increases to profitability reach a plateau.
- The EMA does appear to provide a small benefit with this trading system (compared to using an SMA). Preference should be given to Exponentially Weighted Moving Averages.
- As defined in this study, the strategy (both long and short) has some potential, however the small number of trades and large drawdowns are issues.
As Utilized On An Individual Stock
When this strategy is run on an individual stock such as Intel Corporation (INTC), the following best practices apply. With regard to applying any strategy to an individual stock – it is rare that the results are similar. This makes it extremely difficult to measure an algorithm in the broad context of “applies to all stocks”. The general rule is, unless proven otherwise – a strategy should be laser focused on a specific stock and data acquired from any analysis should be viewed with a skeptical eye, when applied to other stocks.
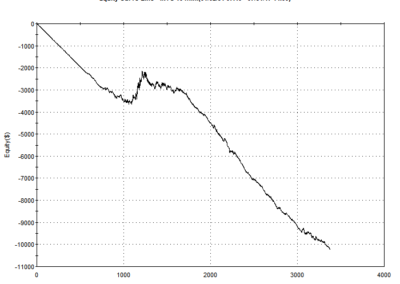
Day Trading Application (10 minute candles)
- This is the absoulte worst case seen with this strategy across all techniques and all asset types. Click here to see the results of this study.
- Warrants additional analysis to see if trading in the opposite direction could be beneficial.
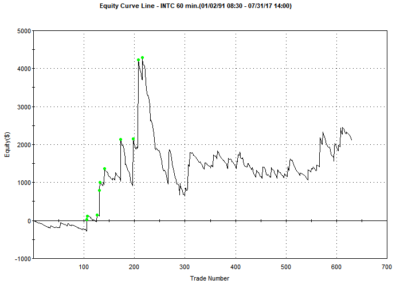
Shorter Term Swing Trades (60 minute candles)
- Results are not good. While this application (shorter term swing trade) works well on an index, it does not work well on the INTC. Click here to see the results of this study.
Longer Term Swing Trades (daily candles)
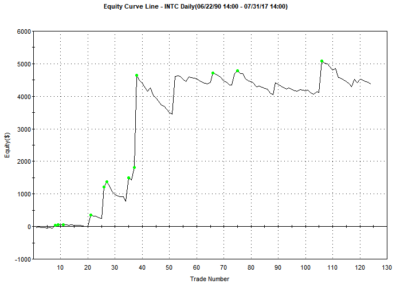
- This is the best case we found when analyzing this trading strategy on an individual stock such as the INTC. Click here to view the results of this analysis.
- The performance is slightly better than a buy & hold strategy on the INTC.
- While the performance is ok, it is still not good enough due to the small number of trades, large drawdown and low profit factor.
Potential Next Steps – “How could this strategy be improved?”
Consider the following modifications:
1. Add a stop market order, or perhaps a trailing stop. This could minimize the drawdown to a more acceptable level.
2. Add an exit Limit order
3. Consider mean reversion entries instead of trend following
4. Consider using this entry/exit signal as a part of a different system which would leverage the information gleaned – creating a brand new trading algorithm.

