Moving Average Price Crossing Trading Strategy: INTC Longer Term Swing Trade
Applying the Moving Average Price Crossing strategy to INTC with Daily CandlesMoving Average Price Crossover System: Equities (INTC)
Trade Entry/Exit Rules
Stop Settings:
No Stop Used
Limit Settings:
No Limit (target) Used
Buy Trigger(s):
New Close Above Moving Average
Sell Trigger(s):
New Close Below Moving Average
LONG Entry Results: Swing Trade (longer term)
| Simulation Setting | |
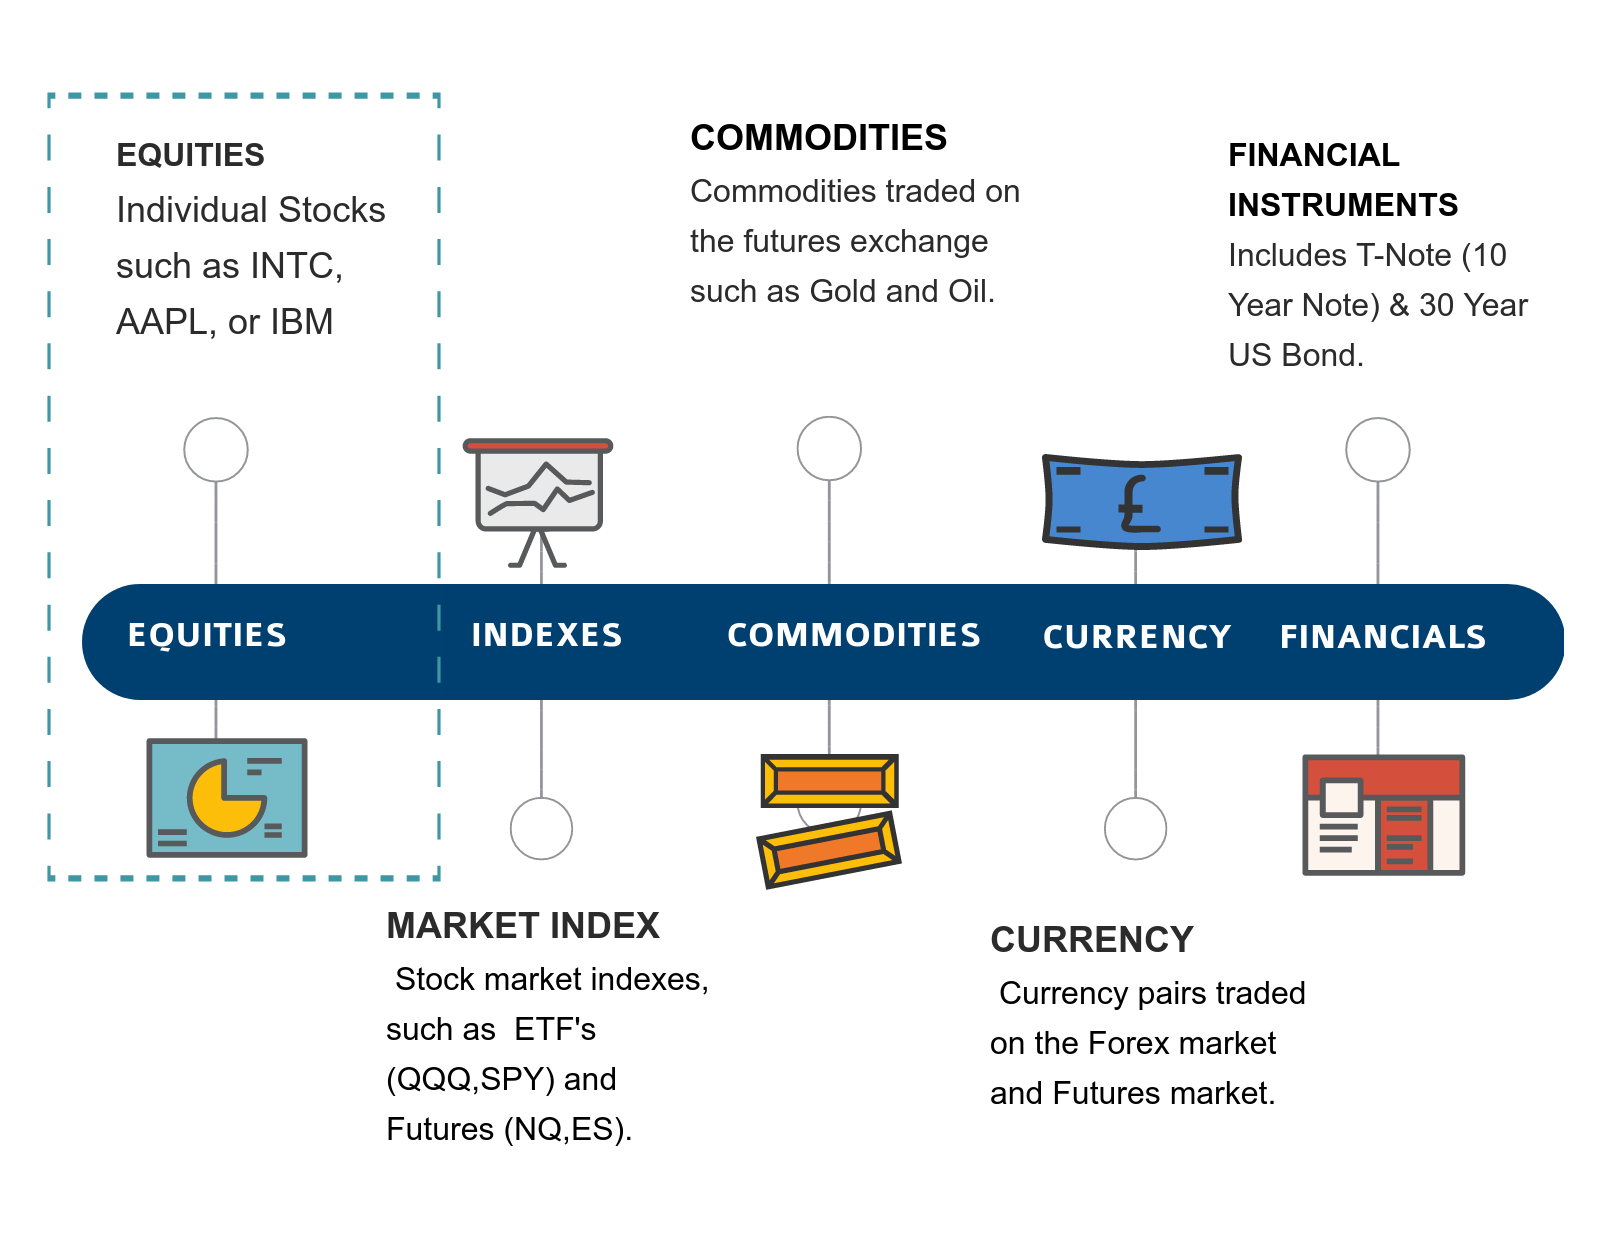
| Asset Type | Equities |
| Symbol | INTC |
| Start Date | 08/29/1991 |
| End Date | 07/31/2017 |
| Trading Session Time | Regular Session Hours |
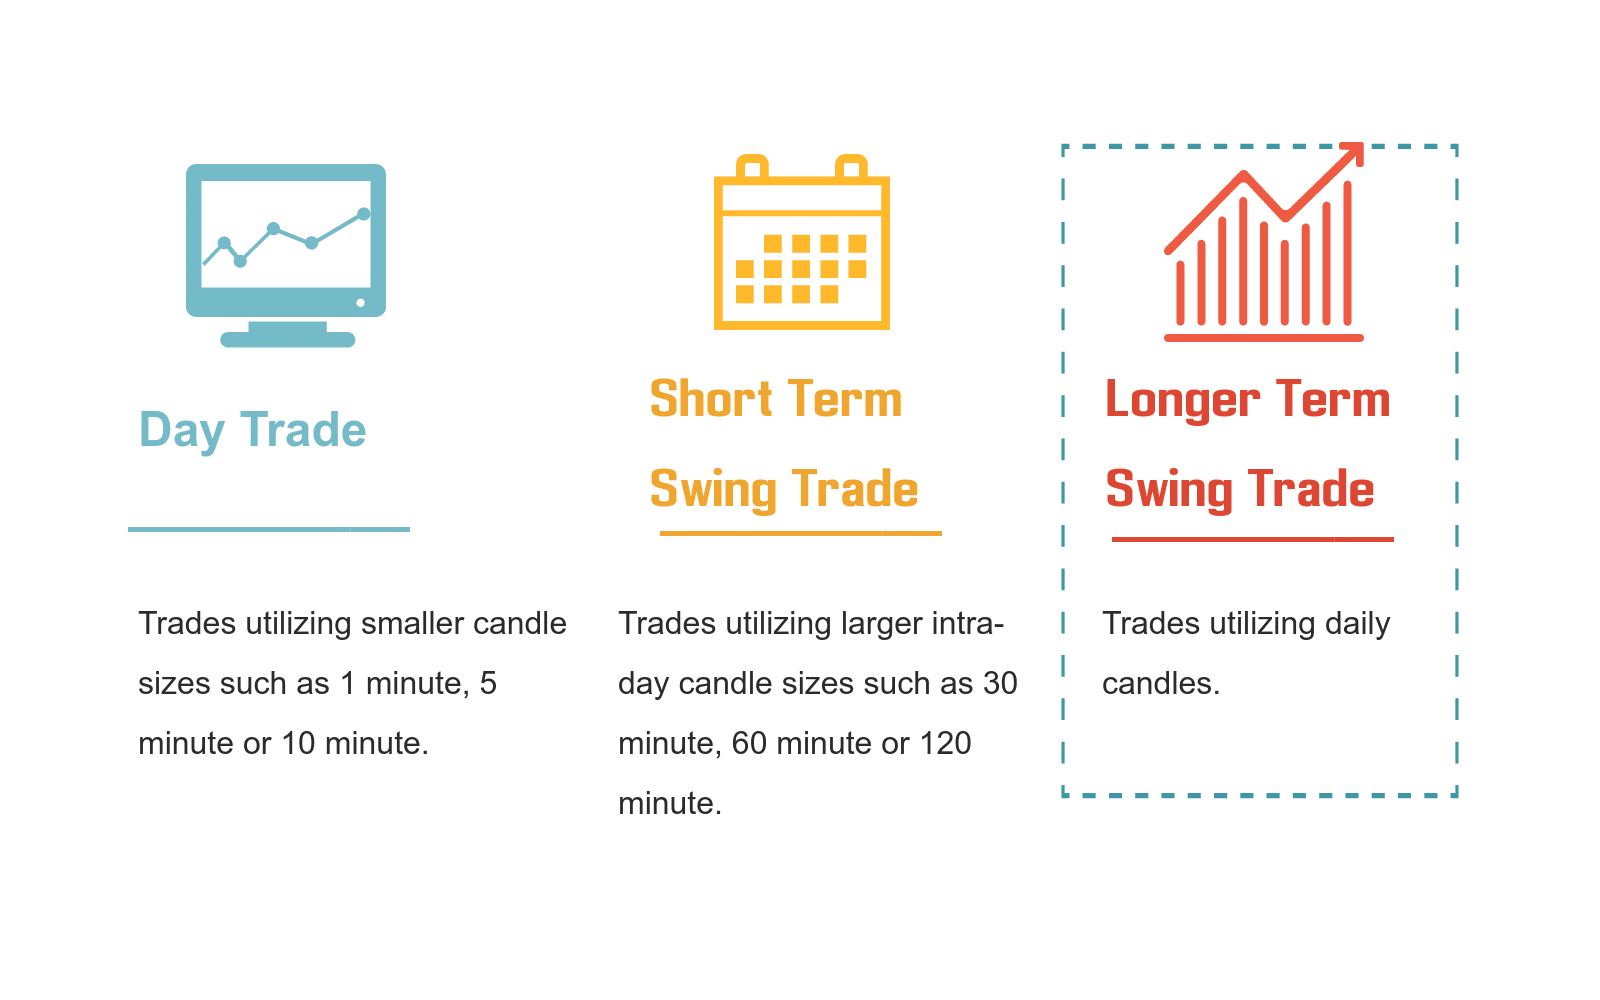
| Trading Application | Swing Trade (longer term) |
| Candle Size | 1 Day |
| Direction | Long |
| Moving Average Type | SMA |
| Moving Average Length | 165 |
| Performance Metric | |
| Profit Factor | 1.82 |
| Net Profit ($) | $4369.00 |
| Gross Profit ($) | $9677.00 |
| Gross Loss ($) | $-5308.00 |
| Total Trades | 124 |
| Average Gain/Trade | $35.23 Per Trade |
| Percent Profitable | 25.81% |
| Maximum Drawdown | $-2426.00 |
Trading Strategy Analysis
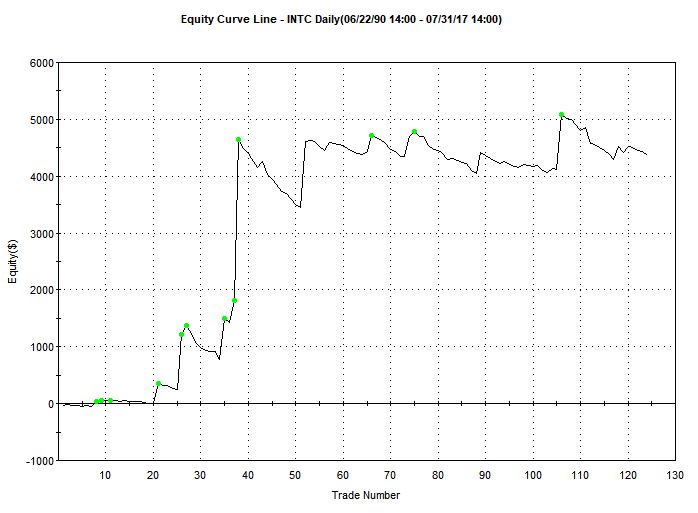
Trading any strategy on an individual stock (such as Intel Corporation) can be very difficult. Of the three combinations tested with the Moving Average Price Crossing trading strategy, the daily charts seems to have the most promise. This setup is profitable, however there are some issues. First, the total number of trades is below our threshold of 200. Second, the drawdown is still fairly large. Third, the majority of the gains seen occurred on just a few trades.
With that said, as compared to the buy and hold of the INTC, this strategy does show some promise.
[addtoany]