Moving Average Price Crossing Trading Strategy: ES Day Trade
Applying the Moving Average Price Crossing strategy on the ES with 10 Minute CandlesMoving Average Price Crossover System: Market Index (ES)
Trade Entry/Exit Rules
Stop Settings:
No Stop Used
Limit Settings:
No Limit (target) Used
Buy Trigger(s):
New Close Above Moving Average
Sell Trigger(s):
New Close Below Moving Average OR Market Close

LONG Entry Results: Day Trade
| Simulation Setting | |
| Asset Type | Futures |
| Symbol | @ES |
| Start Date | 08/23/1999 |
| End Date | 08/01/2017 |
| Trading Session Time | 930EST to 1610EST |
| Trading Application | Day Trade |
| Candle Size | 10 Minutes |
| Direction | Long |
| Moving Average Type | EMA |
| Moving Average Length | 190 |
| Performance Metric | |
| Profit Factor | 1.11 |
| Net Profit ($) | $28365.00 |
| Gross Profit ($) | $291165.00 |
| Gross Loss ($) | $-262800.00 |
| Total Trades | 3062 |
| Average Gain/Trade | $9.26 Per Trade |
| Percent Profitable | 29.29% |
| Maximum Drawdown | $-11428.75 |
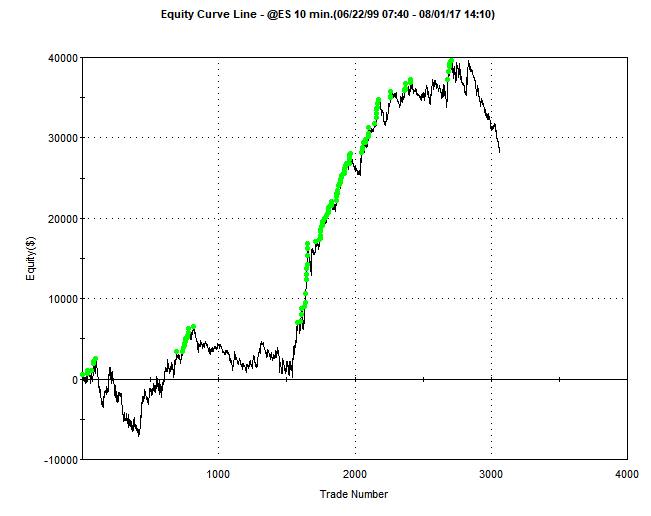
Trading Strategy Analysis
This application is a good example of a system that looks OK (based on the equity curve), but in reality is not a good system. There is an improvement on the Maximum Drawdown (probably due to the fact that all trades are exited at the close, no overnight gap risk). However, the average gain per trade is way too low. At approximately $9 per trade (average win and losers), this is approximately 1 tick on the ES. If on average the system incurred only 1 extra tick of slippage, the entire system would be non-profitable and would be at a loss. This is a common issue with day-trading algorithms. Namely, the average gain per trade is too low.
This application of the Moving Average Price Crossing trading strategy should be avoided.
[addtoany]