Moving Average Price Crossing Trading Strategy: INTC Day Trade
Applying the Moving Average Price Crossing strategy to INTC with 10 Minute CandlesMoving Average Price Crossover System: Equities (INTC)
Trade Entry/Exit Rules
Stop Settings:
No Stop Used
Limit Settings:
No Limit (target) Used
Buy Trigger(s):
New Close Above Moving Average
Sell Trigger(s):
New Close Below Moving Average OR Market Closes
LONG Entry Results: Day Trade
| Simulation Setting | |
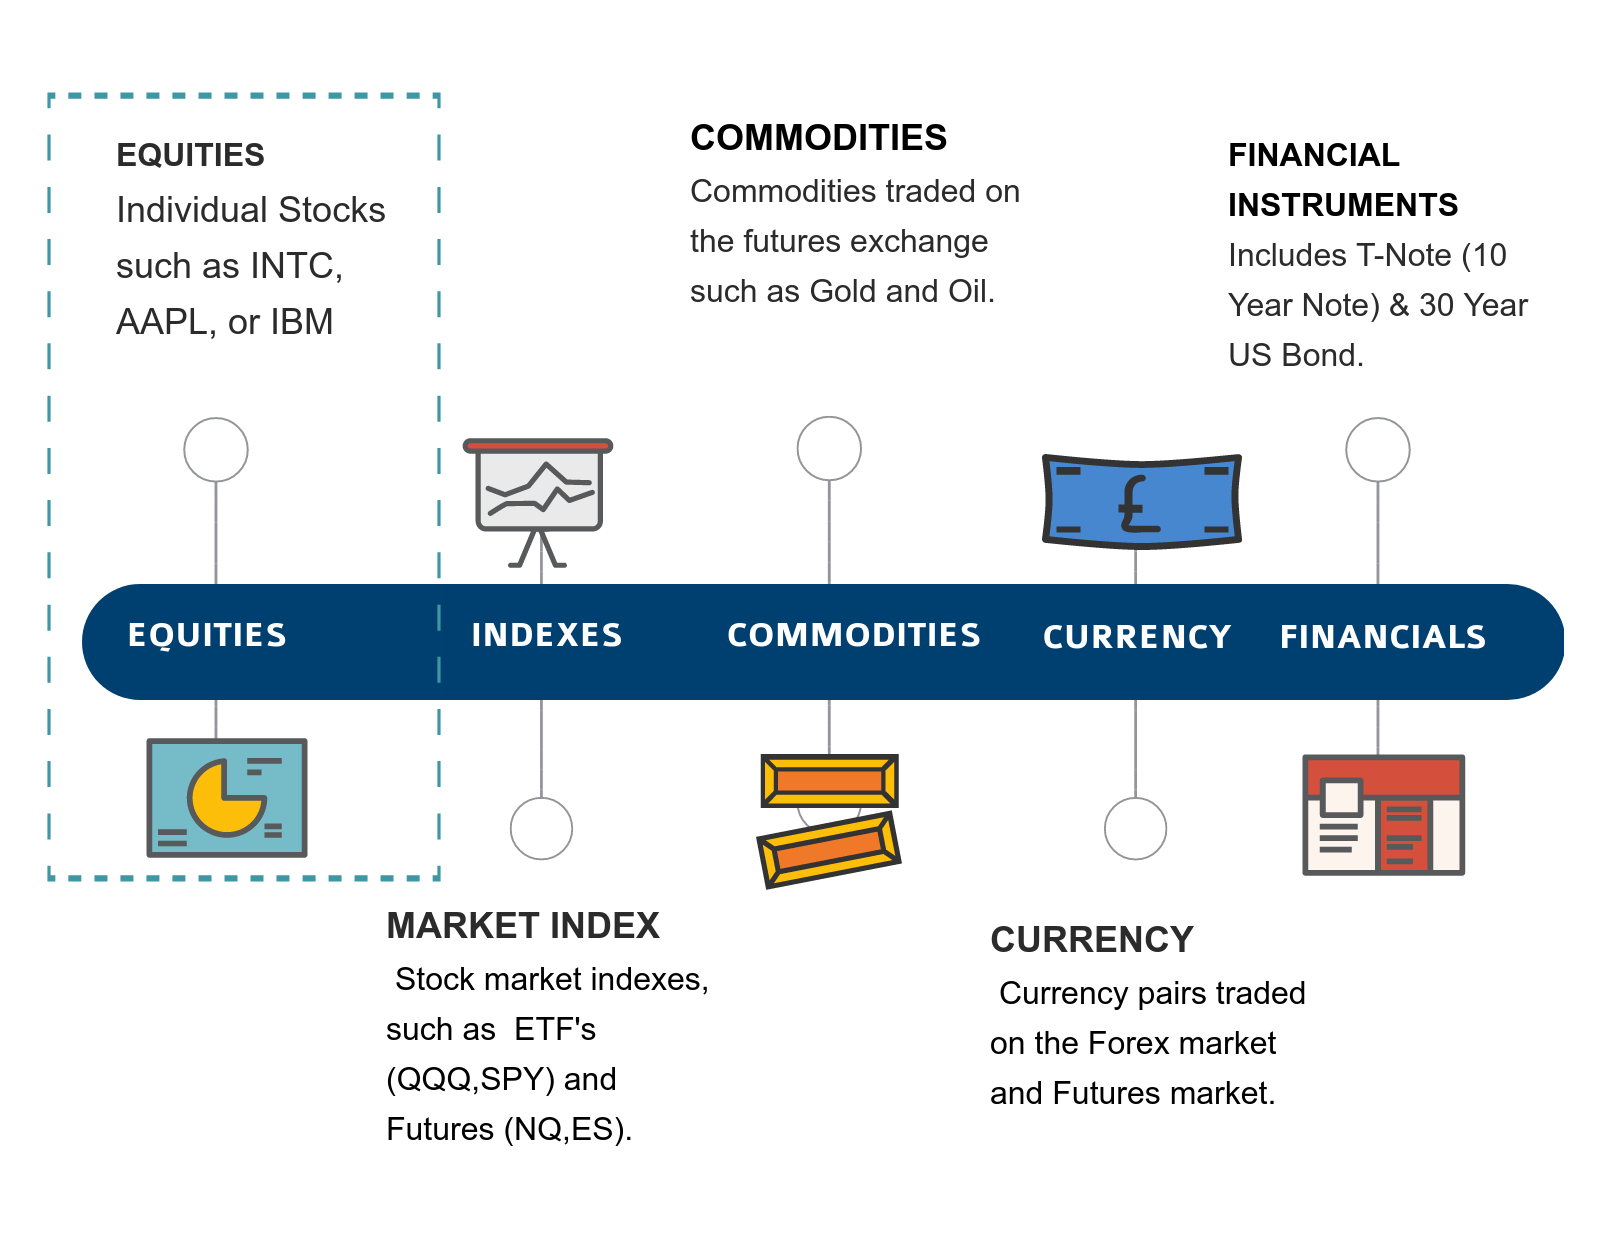
| Asset Type | Equities |
| Symbol | INTC |
| Start Date | 03/06/1991 |
| End Date | 07/31/2017 |
| Trading Session Time | 930EST to 1600EST |
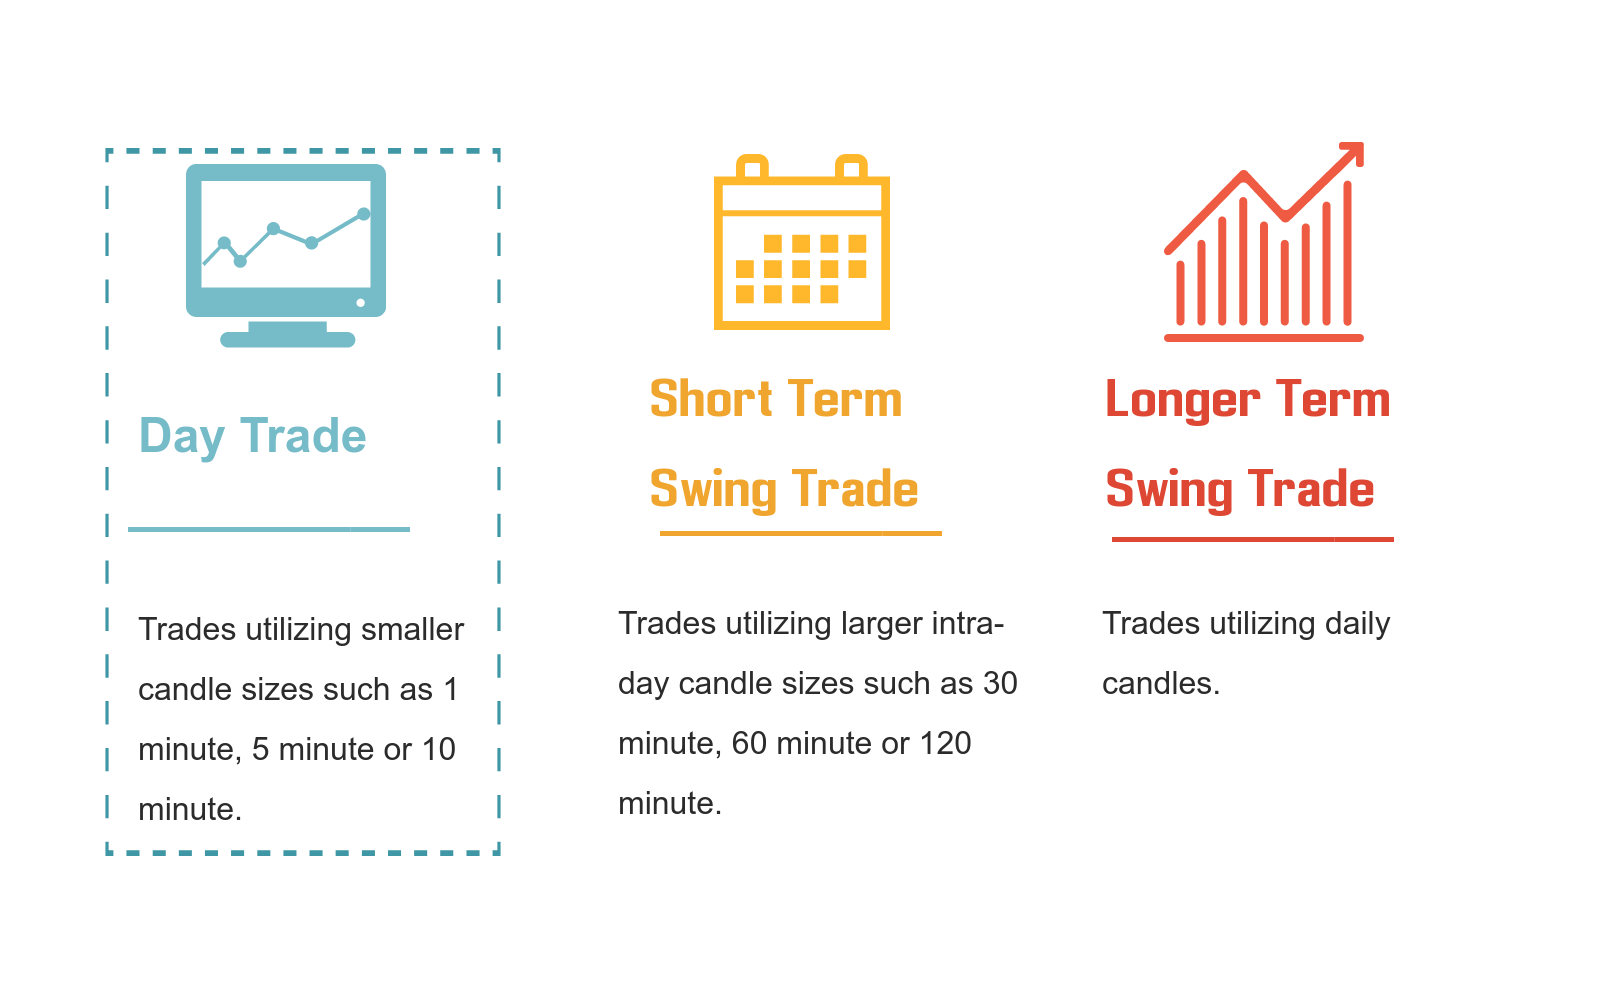
| Trading Application | Day Trade |
| Candle Size | 10 Minutes |
| Direction | Long |
| Moving Average Type | SMA |
| Moving Average Length | 300 |
| Performance Metric | |
| Profit Factor | 0.64 |
| Net Profit ($) | $-10209.00 |
| Gross Profit ($) | $17899.00 |
| Gross Loss ($) | $-28108.00 |
| Total Trades | 3376 |
| Average Gain/Trade | $-3.02 Per Trade |
| Percent Profitable | 20.17% |
| Maximum Drawdown | $-10220.00 |
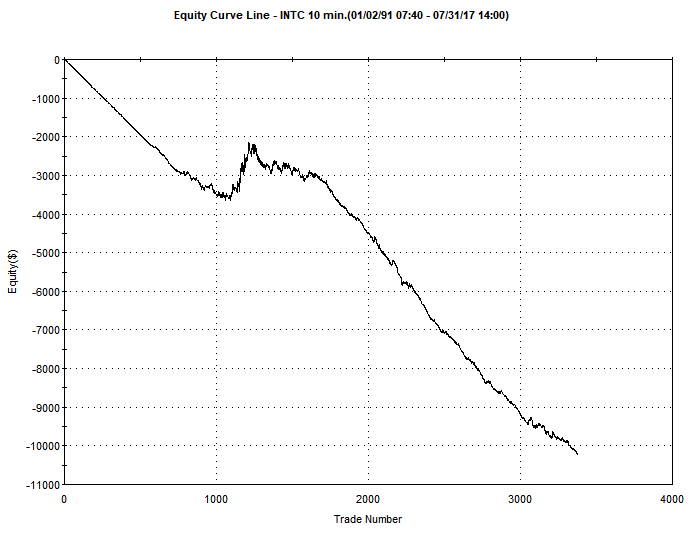
Trading Strategy Analysis
As the equity curve shows, this strategy is about as bad as it gets. Straight down with very few gains. The final optimization showed a Moving Average length of 300 was ideal – which implies that this strategy should NEVER be applied to a stock such as INTC. Of course, this equity curve does beg the question: “What if we instead went short when a new signal was generated?”.
[addtoany]