Moving Average Price Crossing Trading Strategy: ES Shorter Term Swing Trade
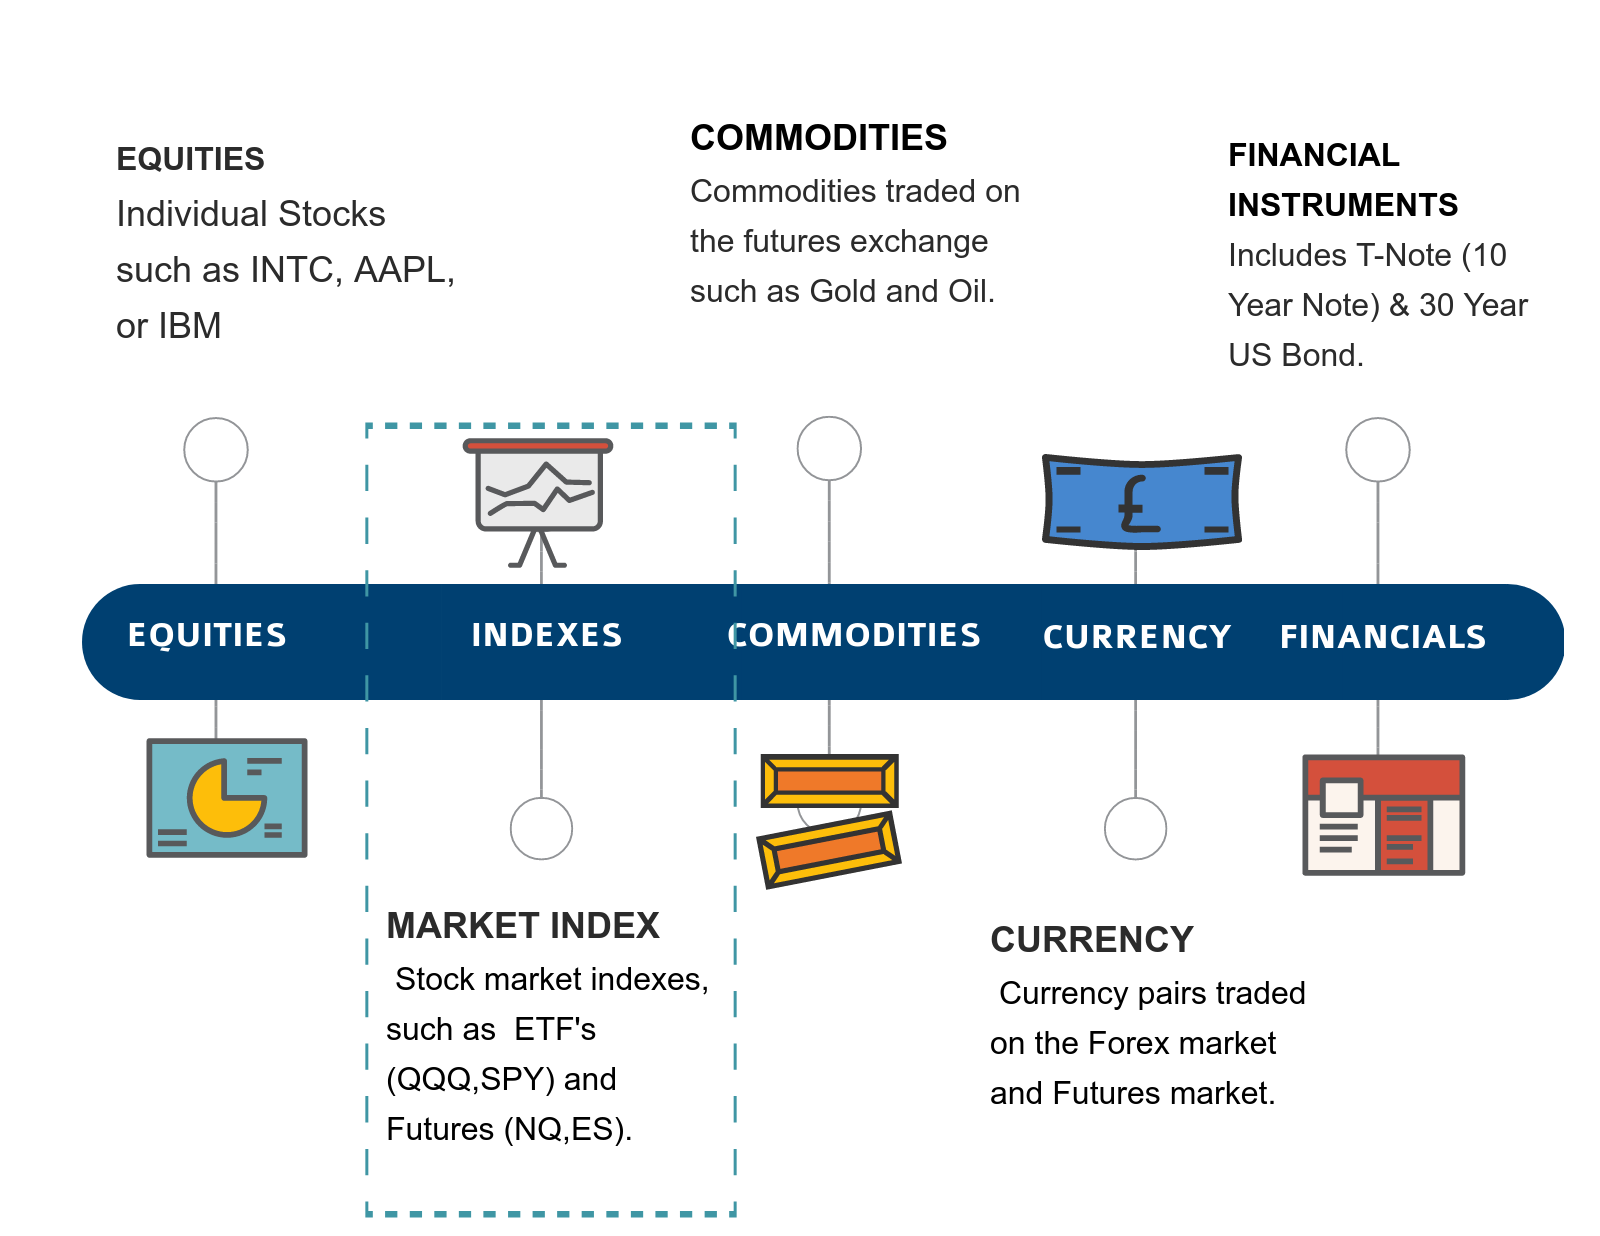
Applying the Moving Average Price Crossing strategy on the ES with 60 Minute CandlesMoving Average Price Crossover System: Market Index (ES)
Trade Entry/Exit Rules
Stop Settings:
No Stop Used
Limit Settings:
No Limit (target) Used
Buy Trigger(s):
New Close Above Moving Average
Sell Trigger(s):
New Close Below Moving Average
LONG Entry Results: Swing Trade (shorter term)
| Simulation Setting | |
| Asset Type | Futures |
| Symbol | @ES |
| Start Date | 11/11/1997 |
| End Date | 08/01/2017 |
| Trading Session Time | 930EST to 1610EST |
| Trading Application | Swing Trade (shorter term) |
| Candle Size | 60.00 Minutes |
| Direction | Long |
| Moving Average Type | EMA |
| Moving Average Length | 110 |
| Performance Metric | |
| Profit Factor | 1.34 |
| Net Profit ($) | $63635.00 |
| Gross Profit ($) | $251000.00 |
| Gross Loss ($) | $-187365.00 |
| Total Trades | 793 |
| Average Gain/Trade | $80.25 Per Trade |
| Percent Profitable | 27.11% |
| Maximum Drawdown | $-15202.50 |

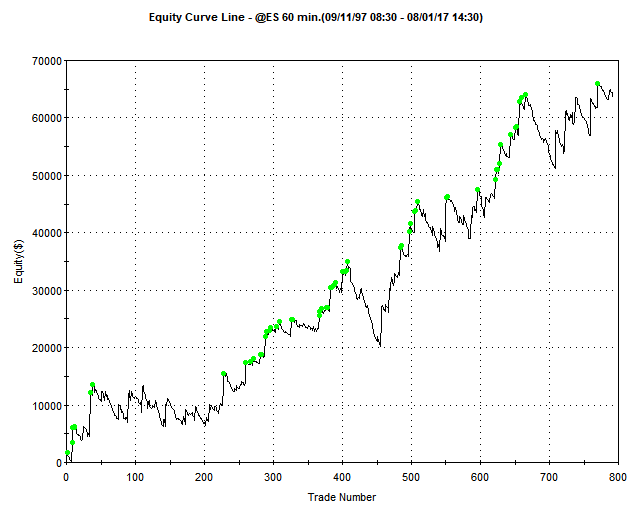
Trading Strategy Analysis
This application shows much more promise than some of the others analyzed using the Moving Average Price Crossover strategy. A few metrics stick out as positives. First, there are a larger number of trades. Second, the profit factor is good enough. Third, the average gain per trade is better. The only issue on a first pass with this strategy is that the Maximum Drawdown is still fairly large. It should be noted however, that it is still better than the Buy & Hold version of this strategy – meaning this setup outperforms the market.
Of all the combinations examined using this strategy – the Shorter Term Swing Trade (market index: ES) is the best case.